計算事例
ここでは直線水路における障害物を含む流れの計算例を示す.
iRICの起動とソルバーの選択
iRICのオープニング画面で,[新しいプロジェクト]を選択(Figure 1 )
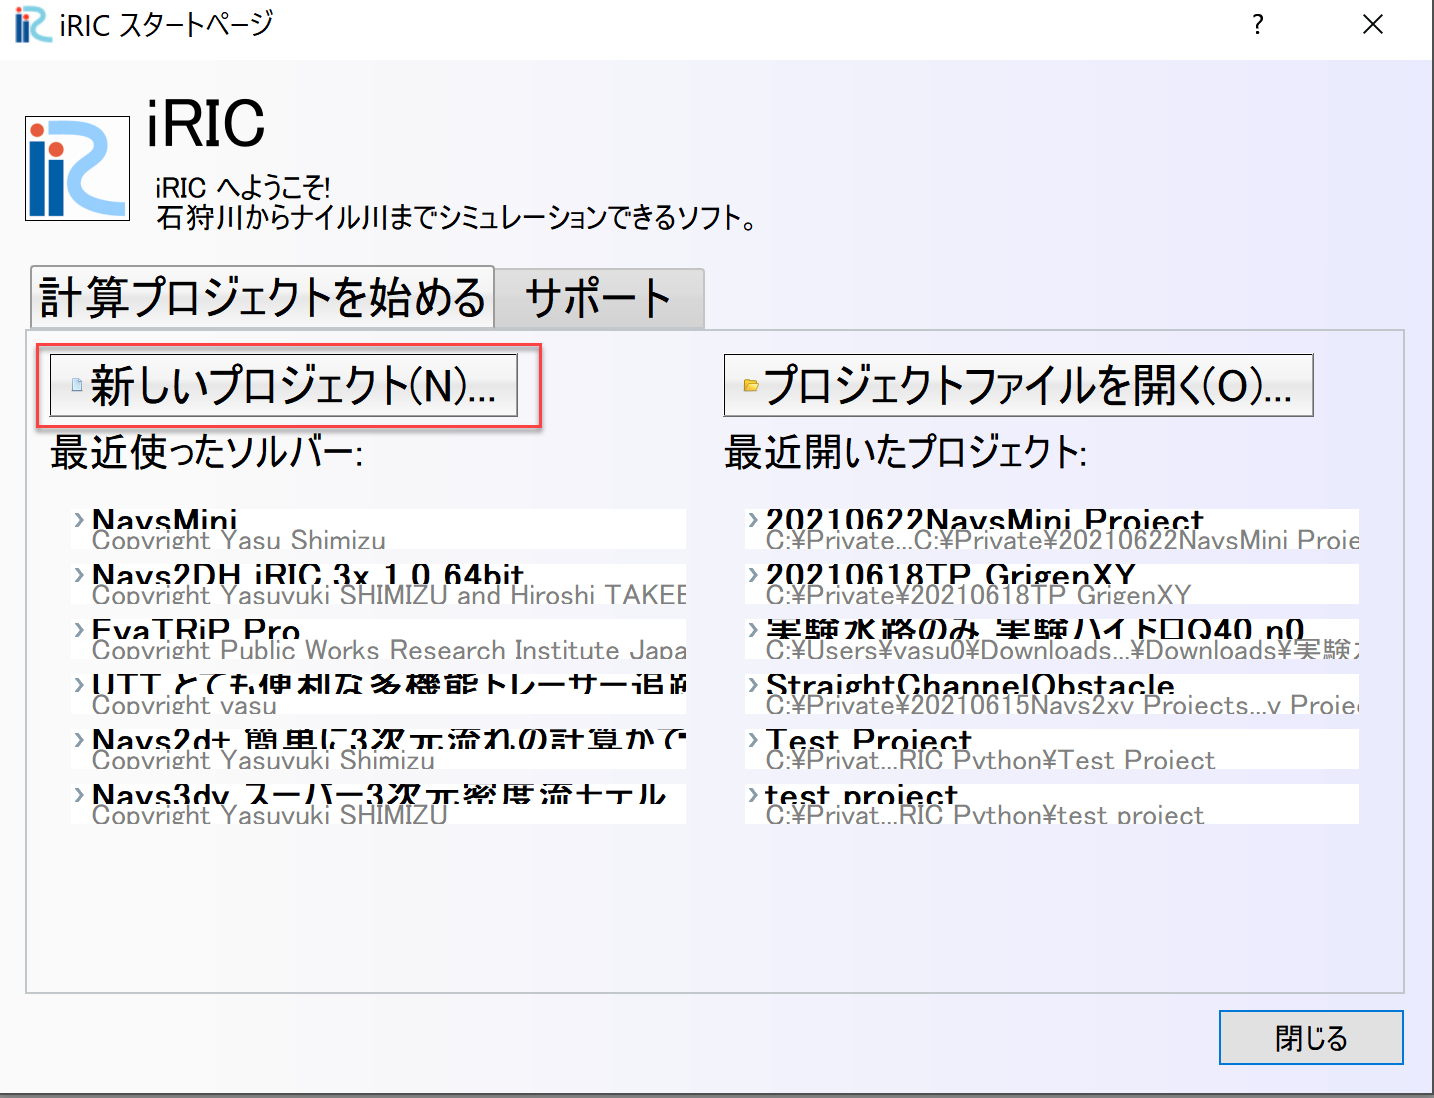
Figure 1 : 新しいプロジェクト
Figure 2 ソルバーの選択Windowで[NaysMini(Pythonで書かれたNays2dHの簡易版)]を選択し, [OK]OKを押す.
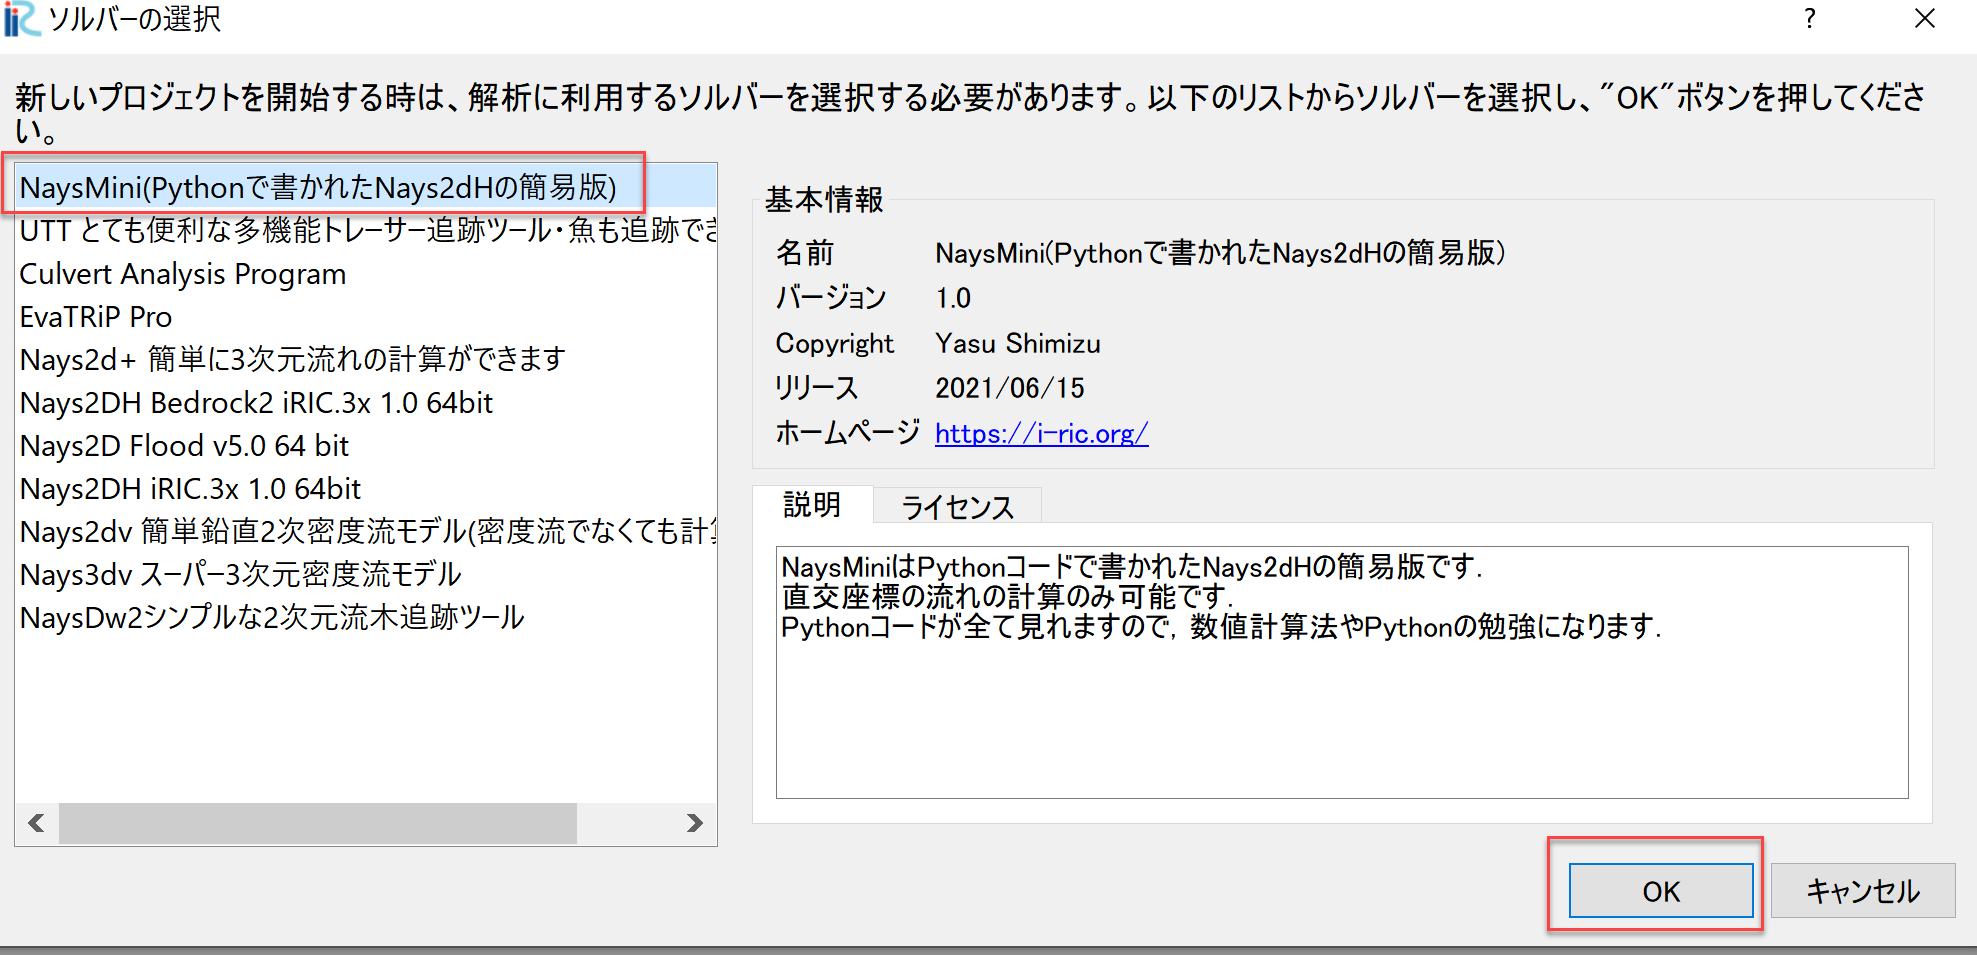
Figure 2 : ソルバーの選択
計算格子の作成
メインメニューから[格子]→[格子生成アルゴリズムの選択]を選ぶ
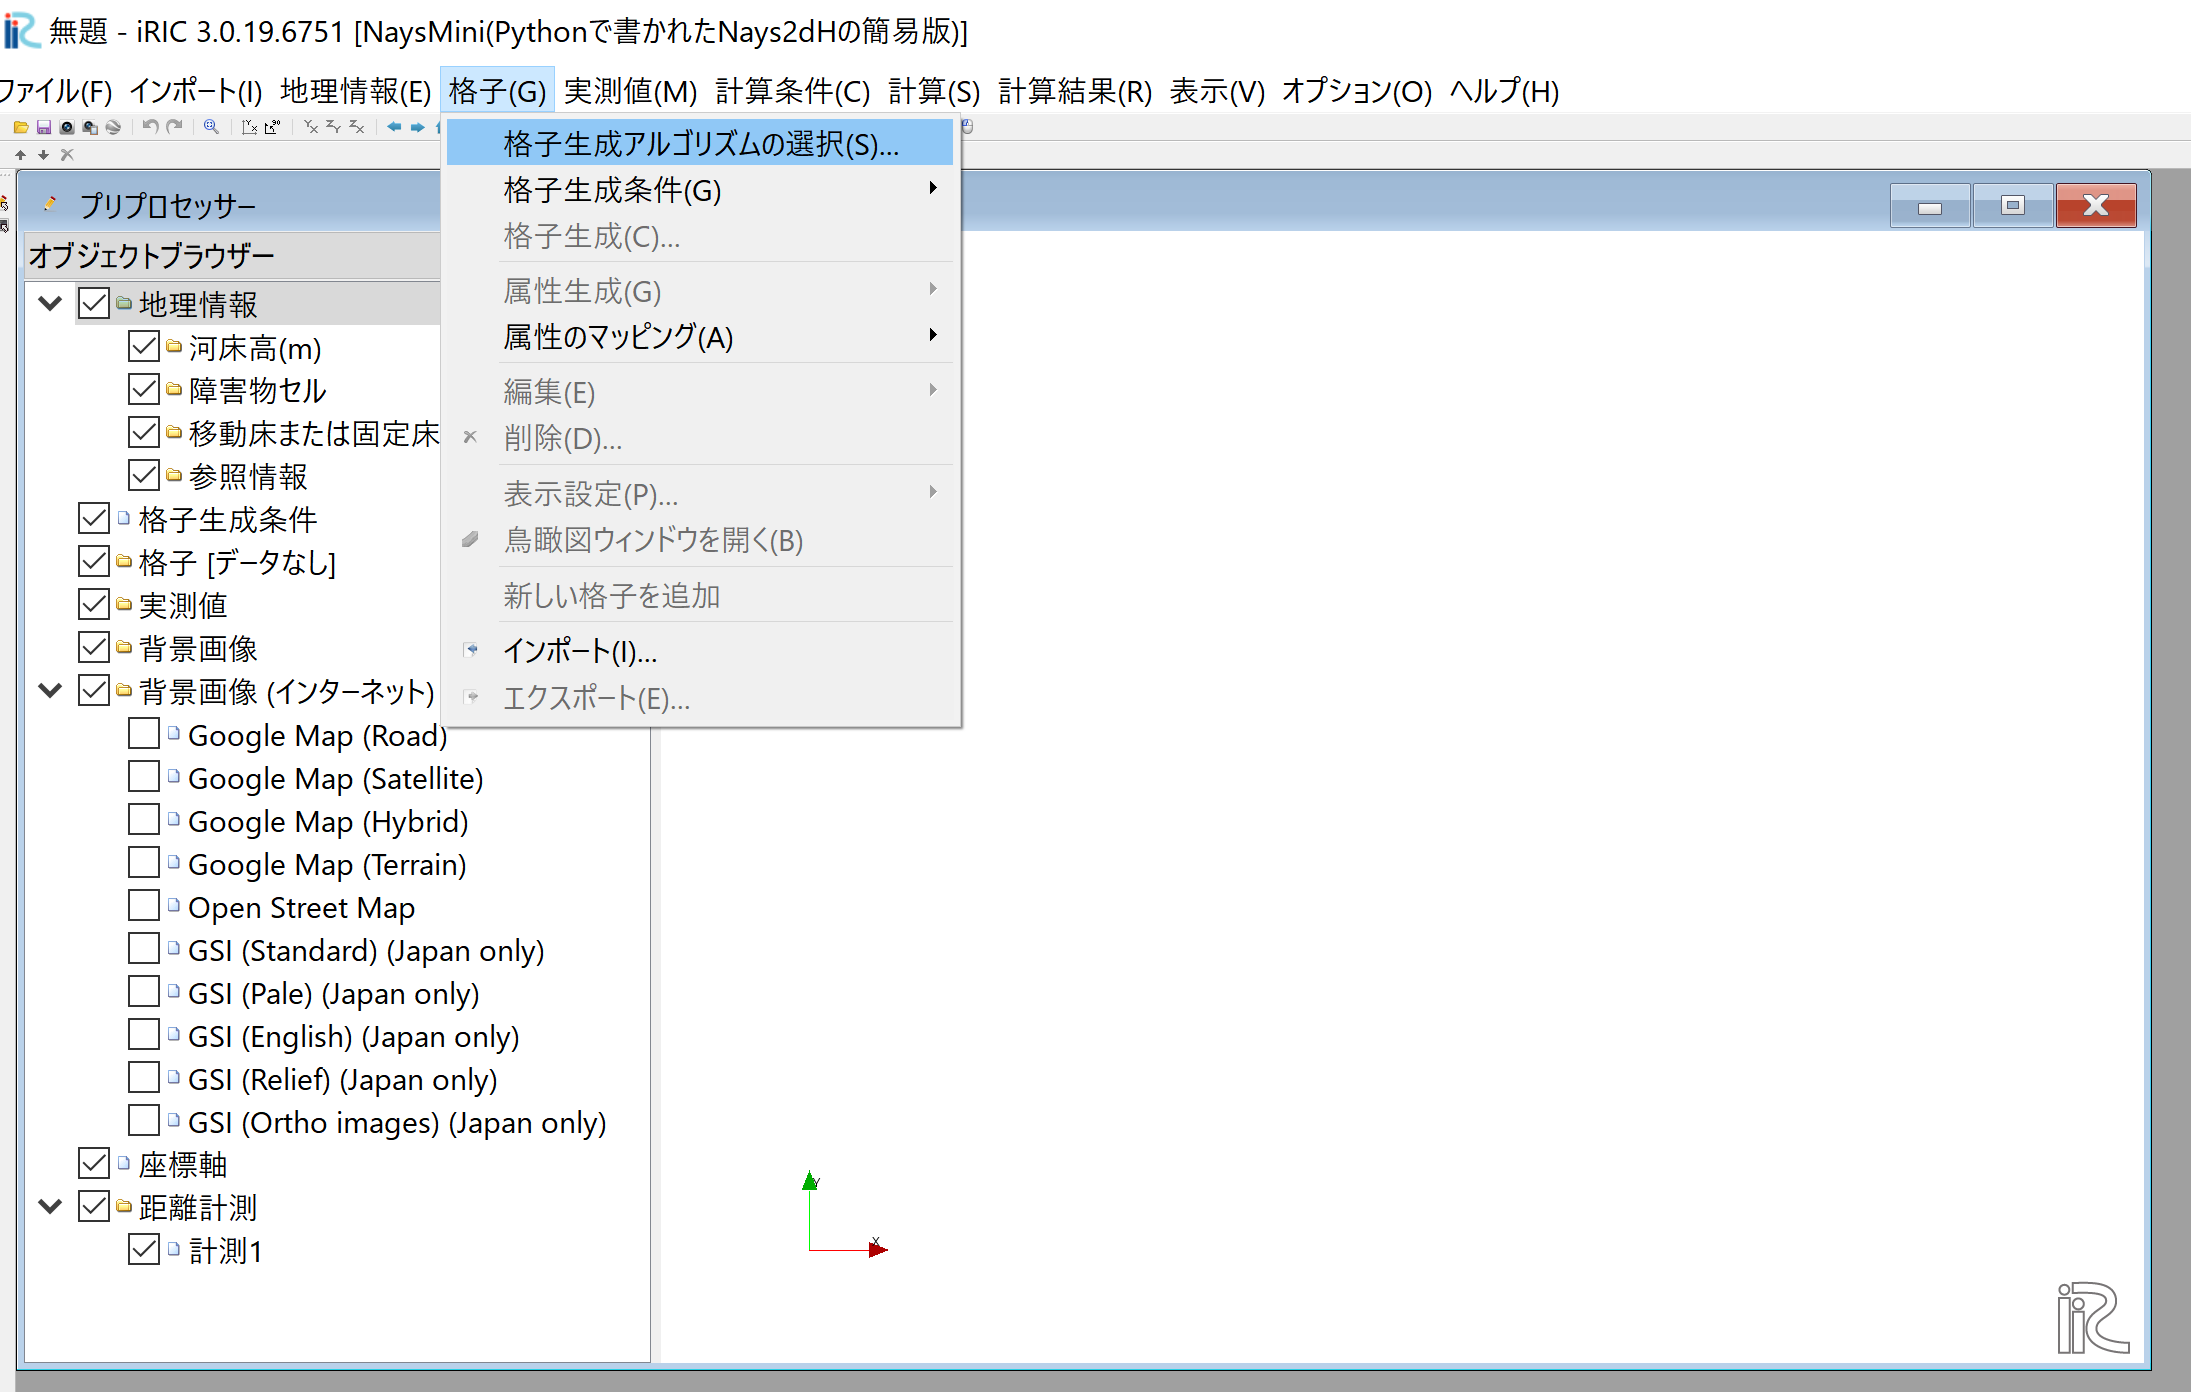
Figure 3 : 格子生成(1)
[格子生成アルゴリズムの選択]ウィンドウで[平面2次元直交格子生成ツール]を選び[OK]を押す.
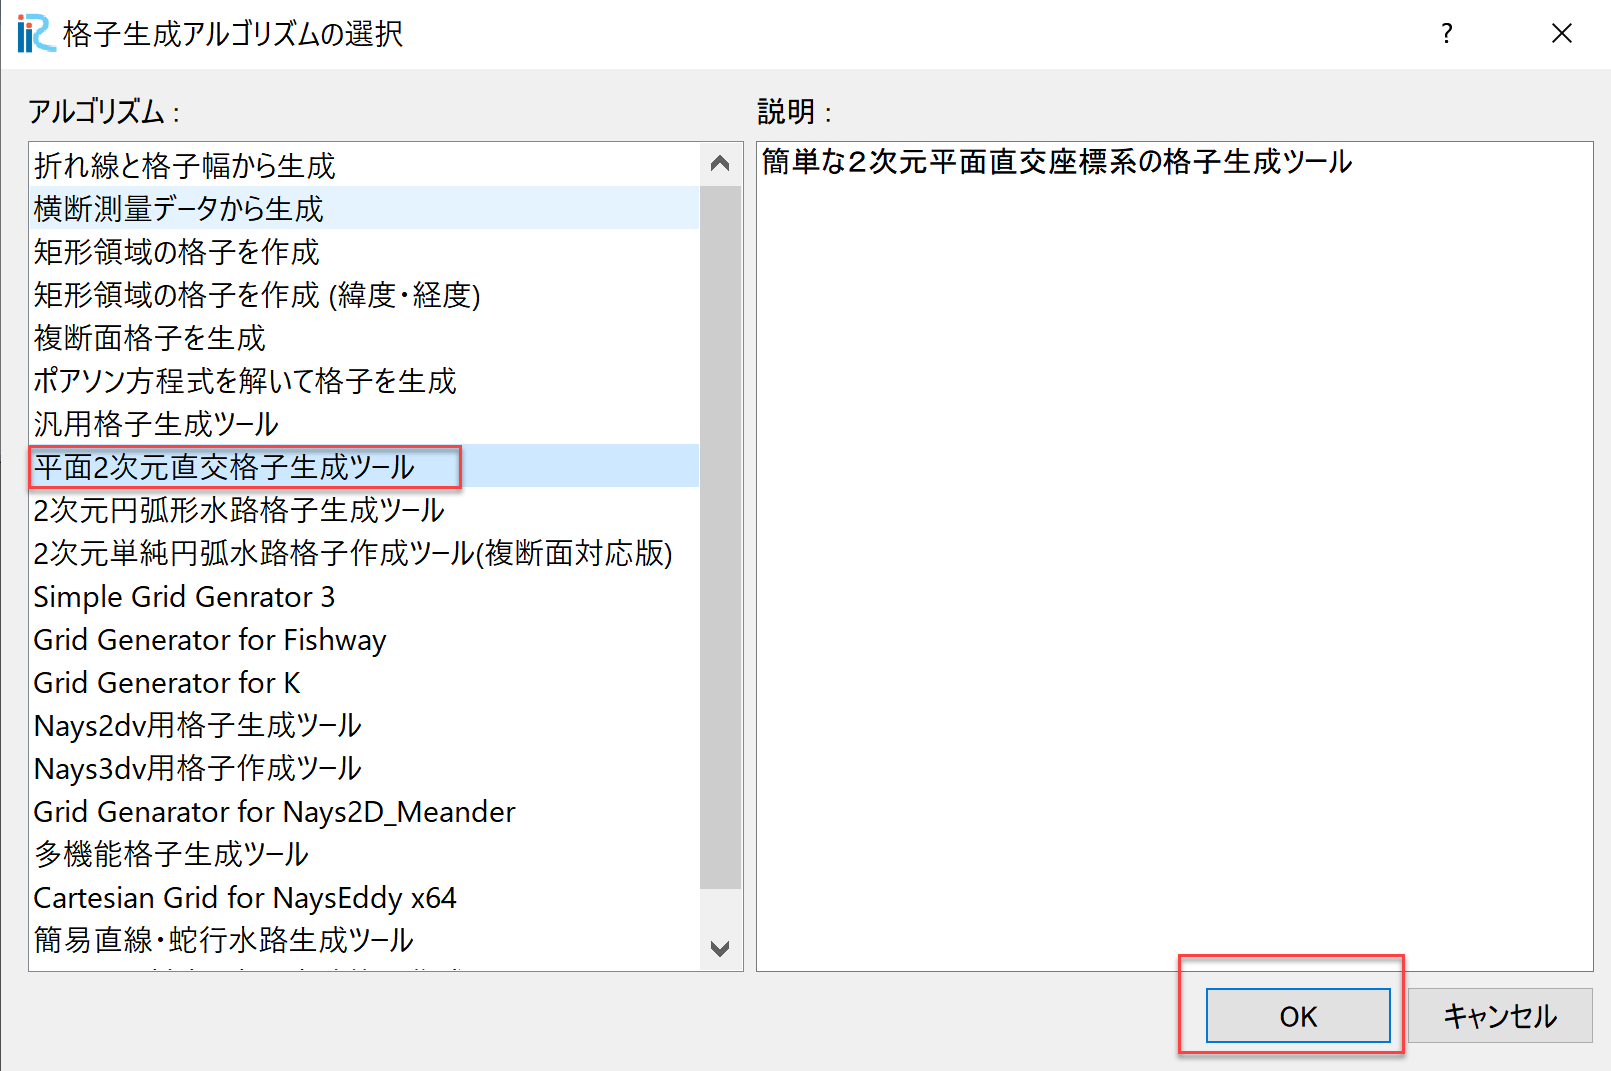
Figure 4 : 格子生成(2)
[格子生成]ウィンドウでパラメータを Figure 5 のように設定し,[格子生成]を押す.
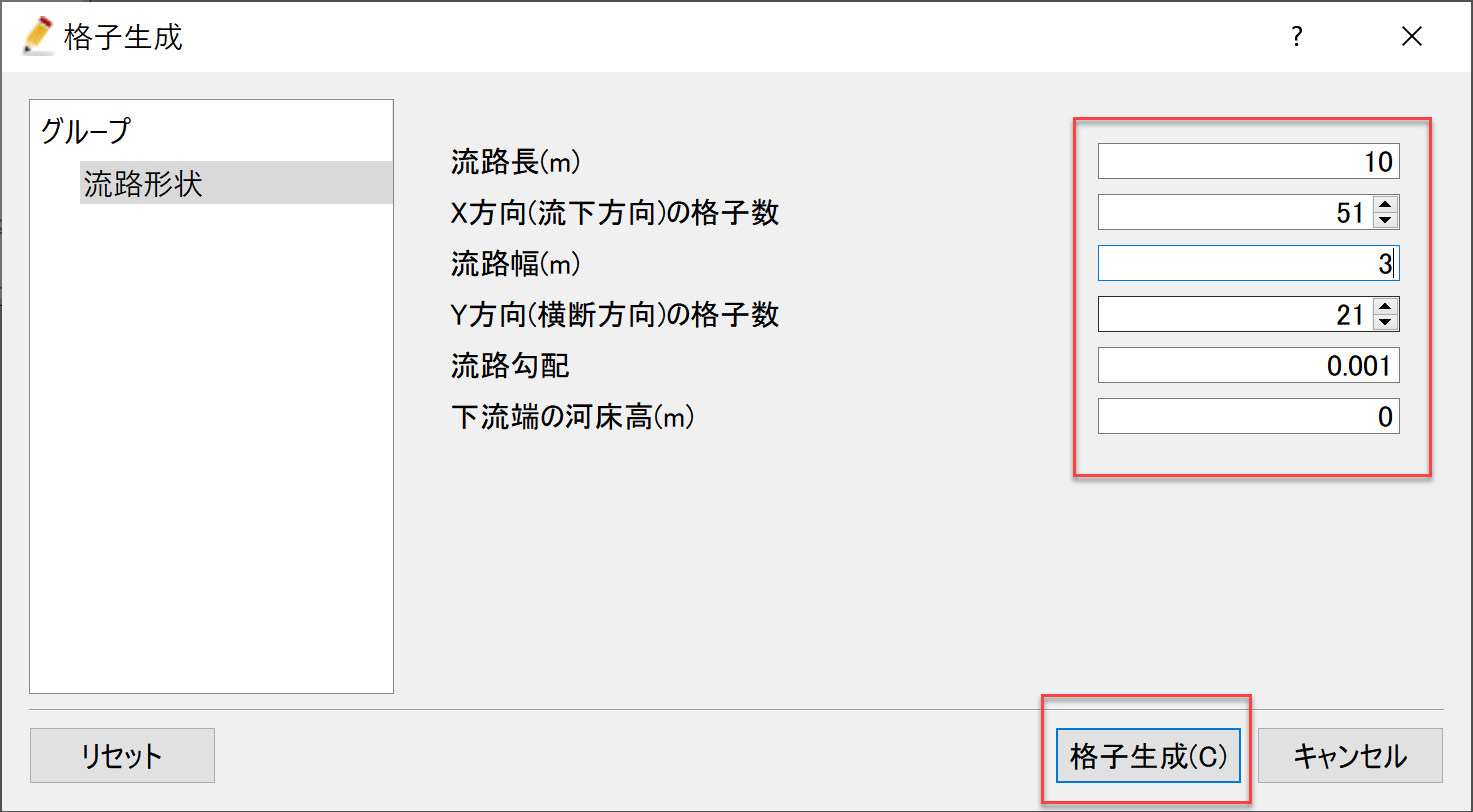
Figure 5 : 格子生成(3)
例によってしつこく「マッピングしますか?」と聞かれるので,[はい]を押す.
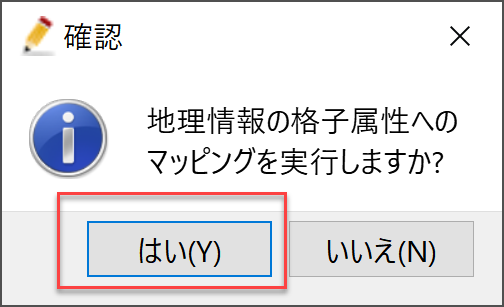
Figure 6 : 格子生成(4)
Figure 7 のような格子が作成される.
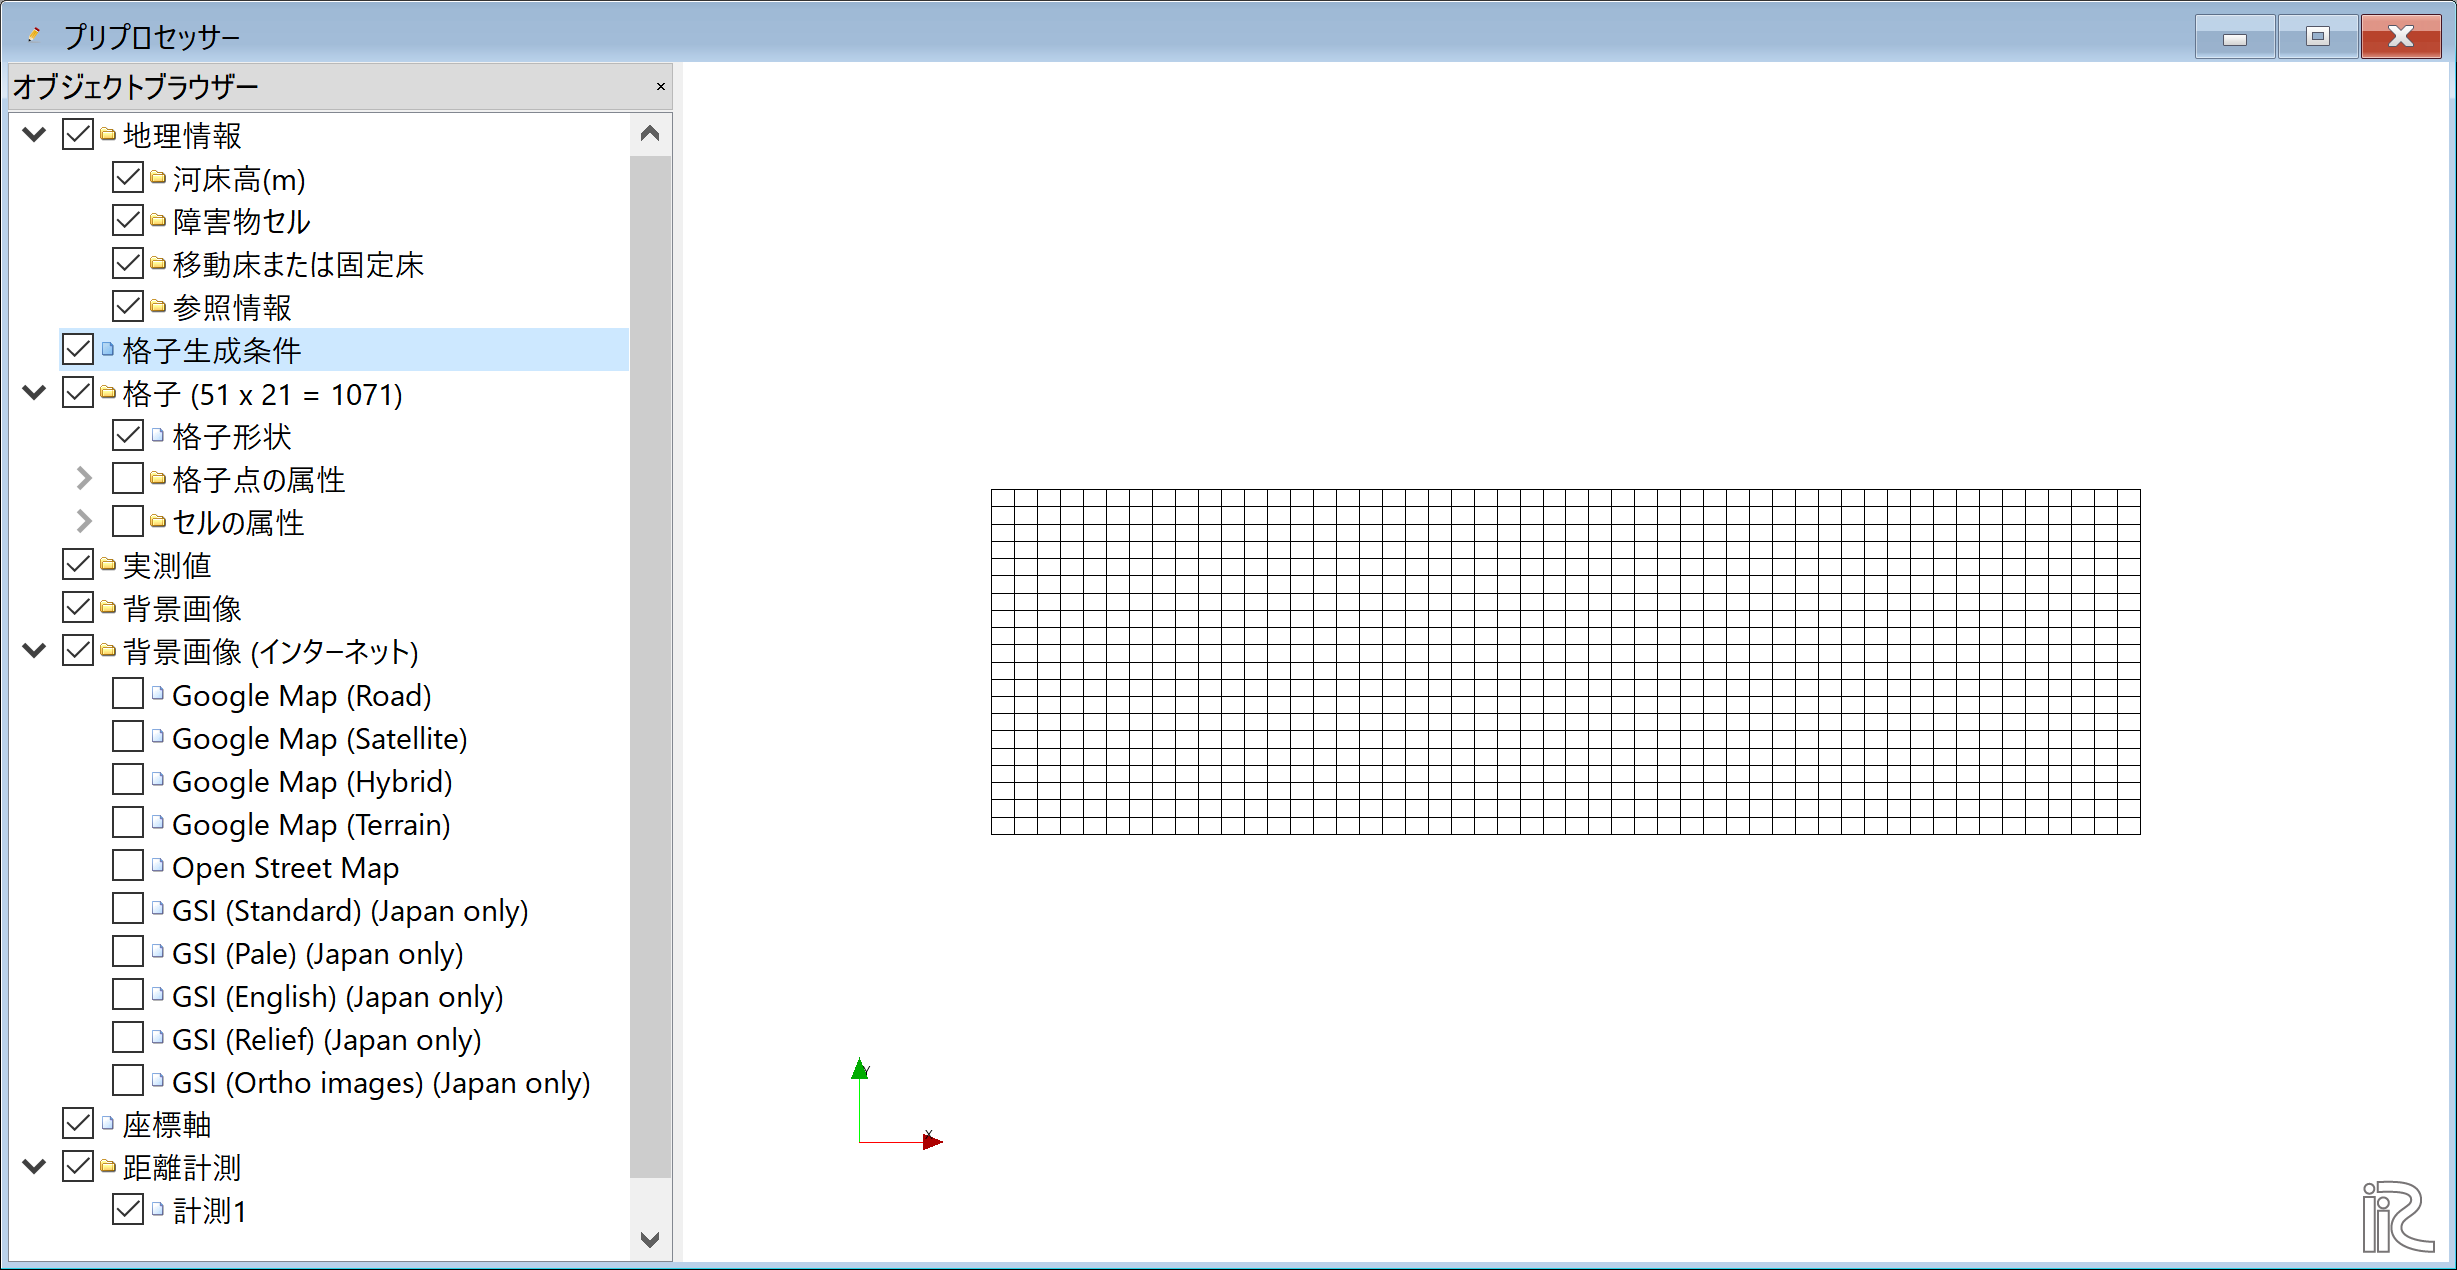
Figure 7 : 格子生成完了
障害物セルの指定
ここでは流路の中央上流側に長方形の障害物を設置する. Figure 8 に示すように, オブジェクトブラウザーの[セルの属性]および[障害物セル]に☑マークを入れ, Figure 9 に示すように障害物にしていしたいセルをマウスで囲い, 右クリックして現れる[障害物セルの編集]ウィンドウで,[障害物セル]に指定し[OK]を押す.
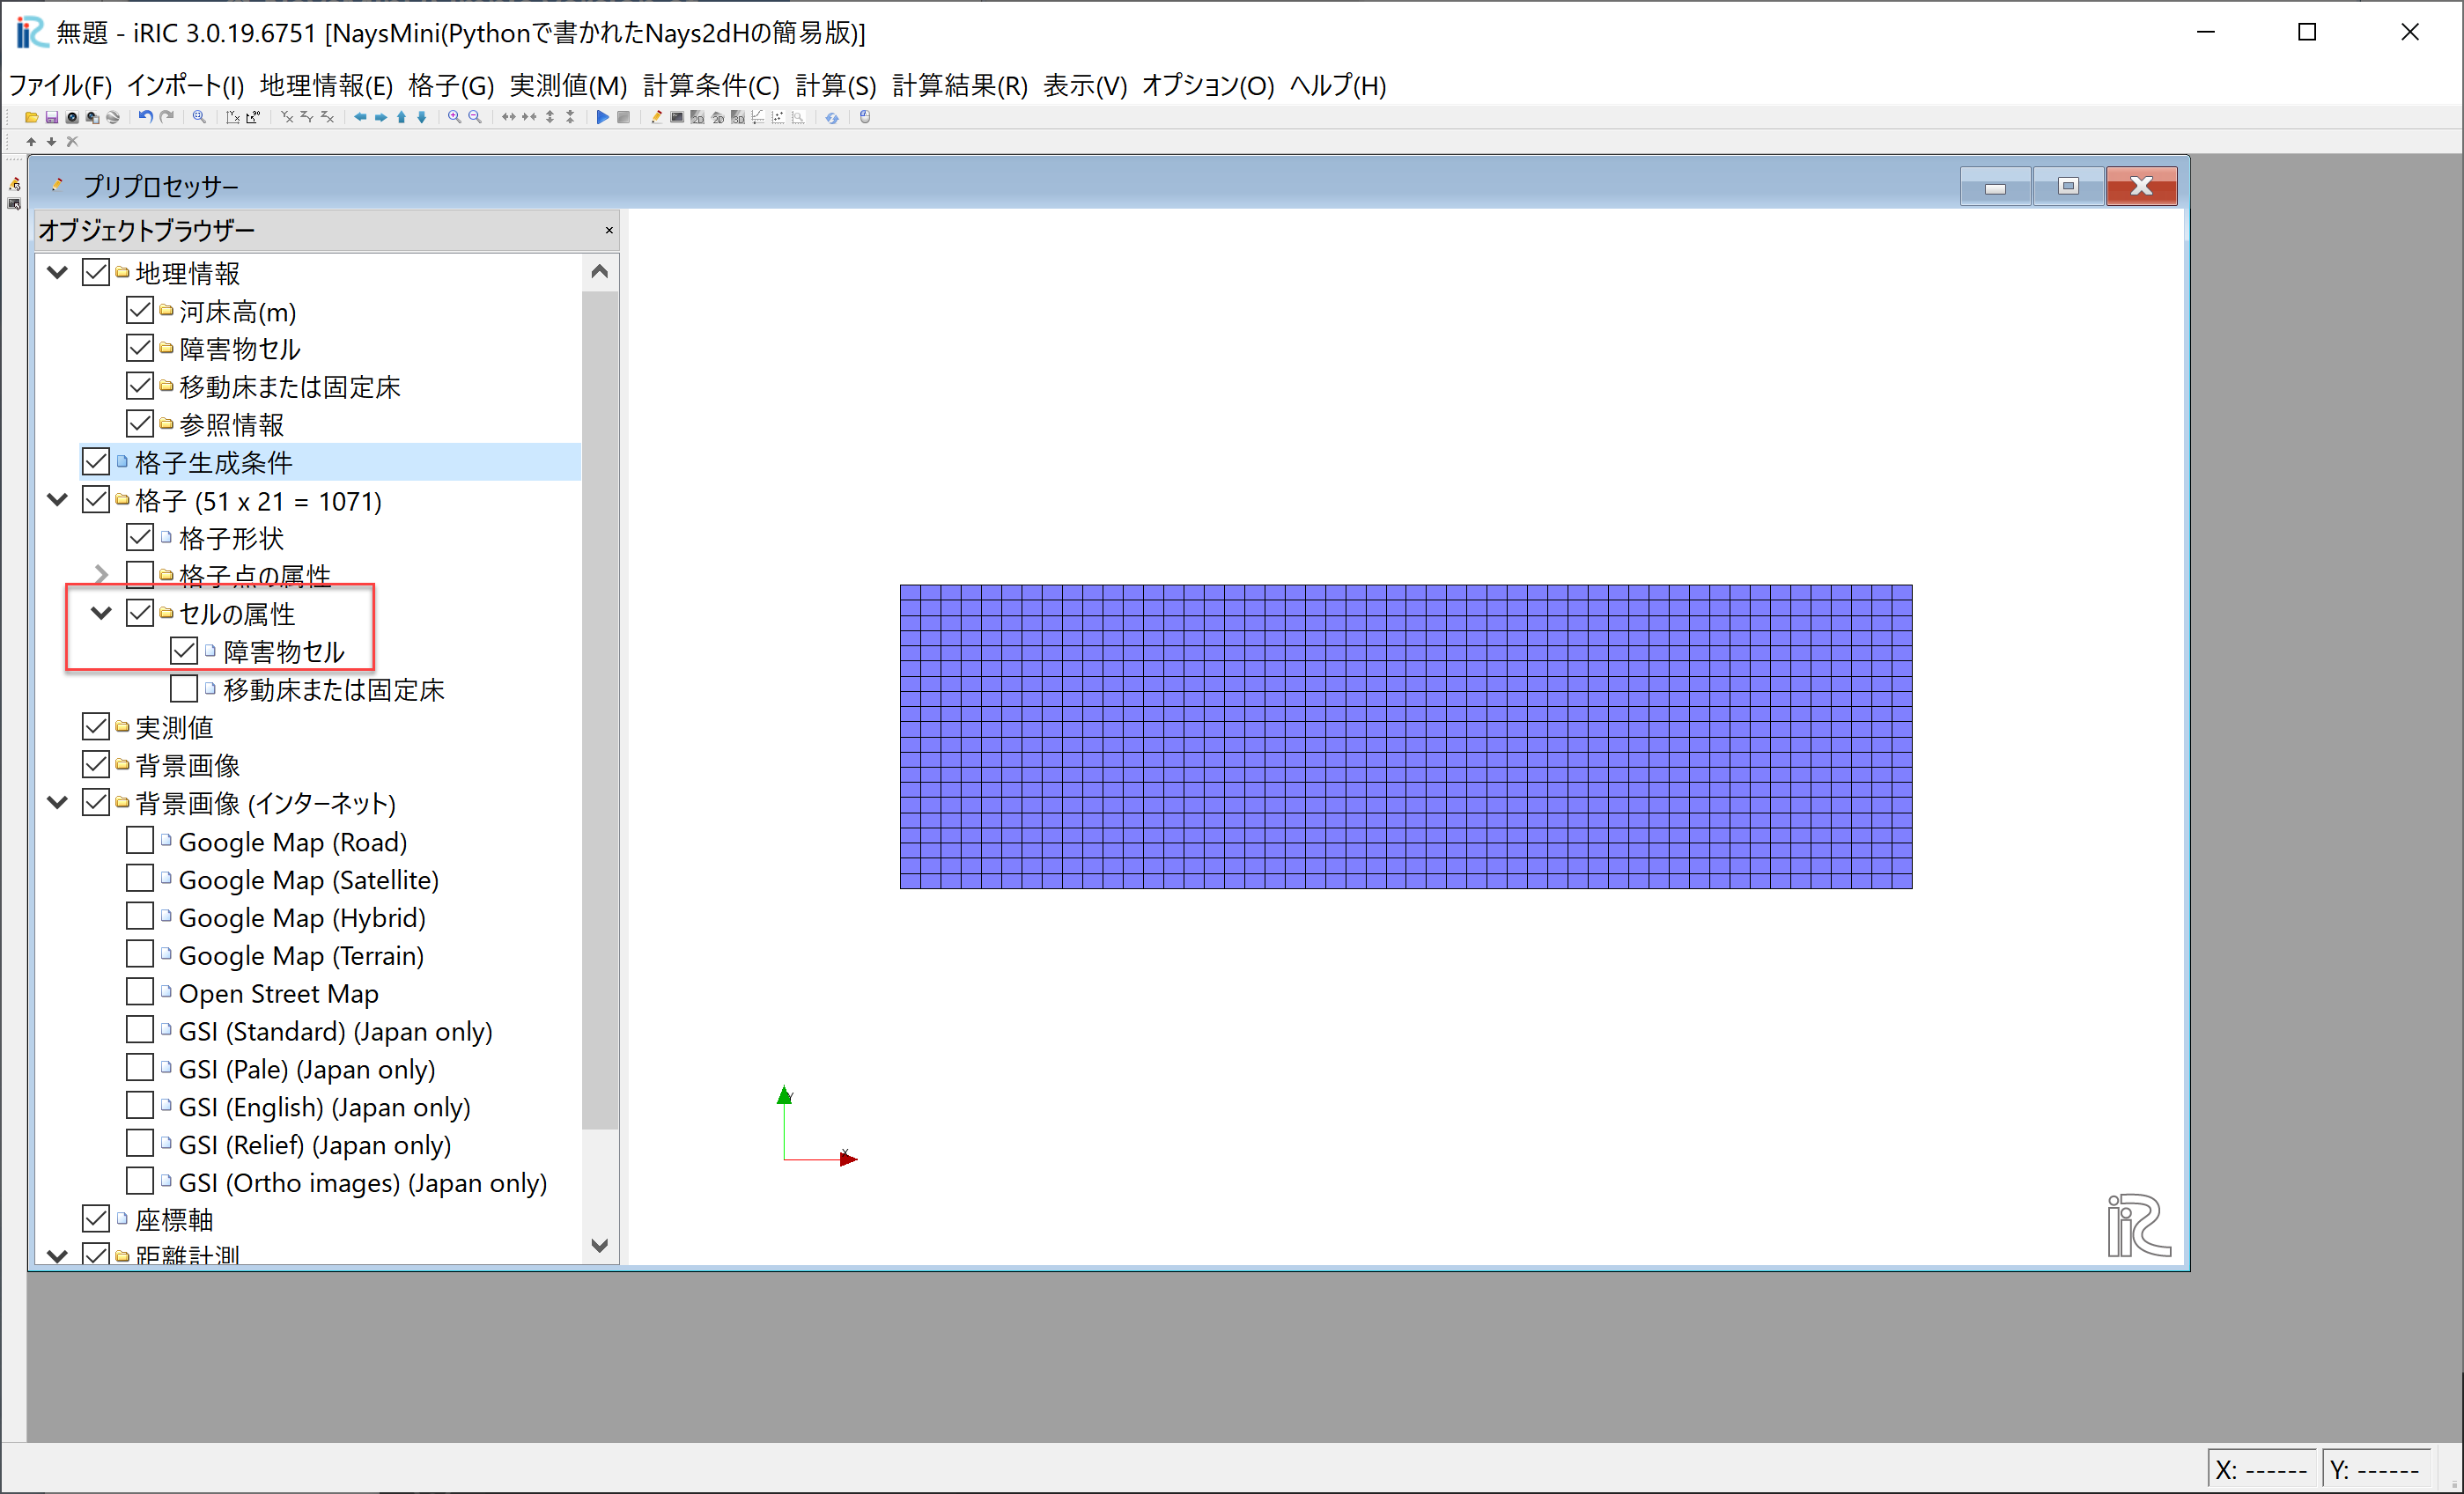
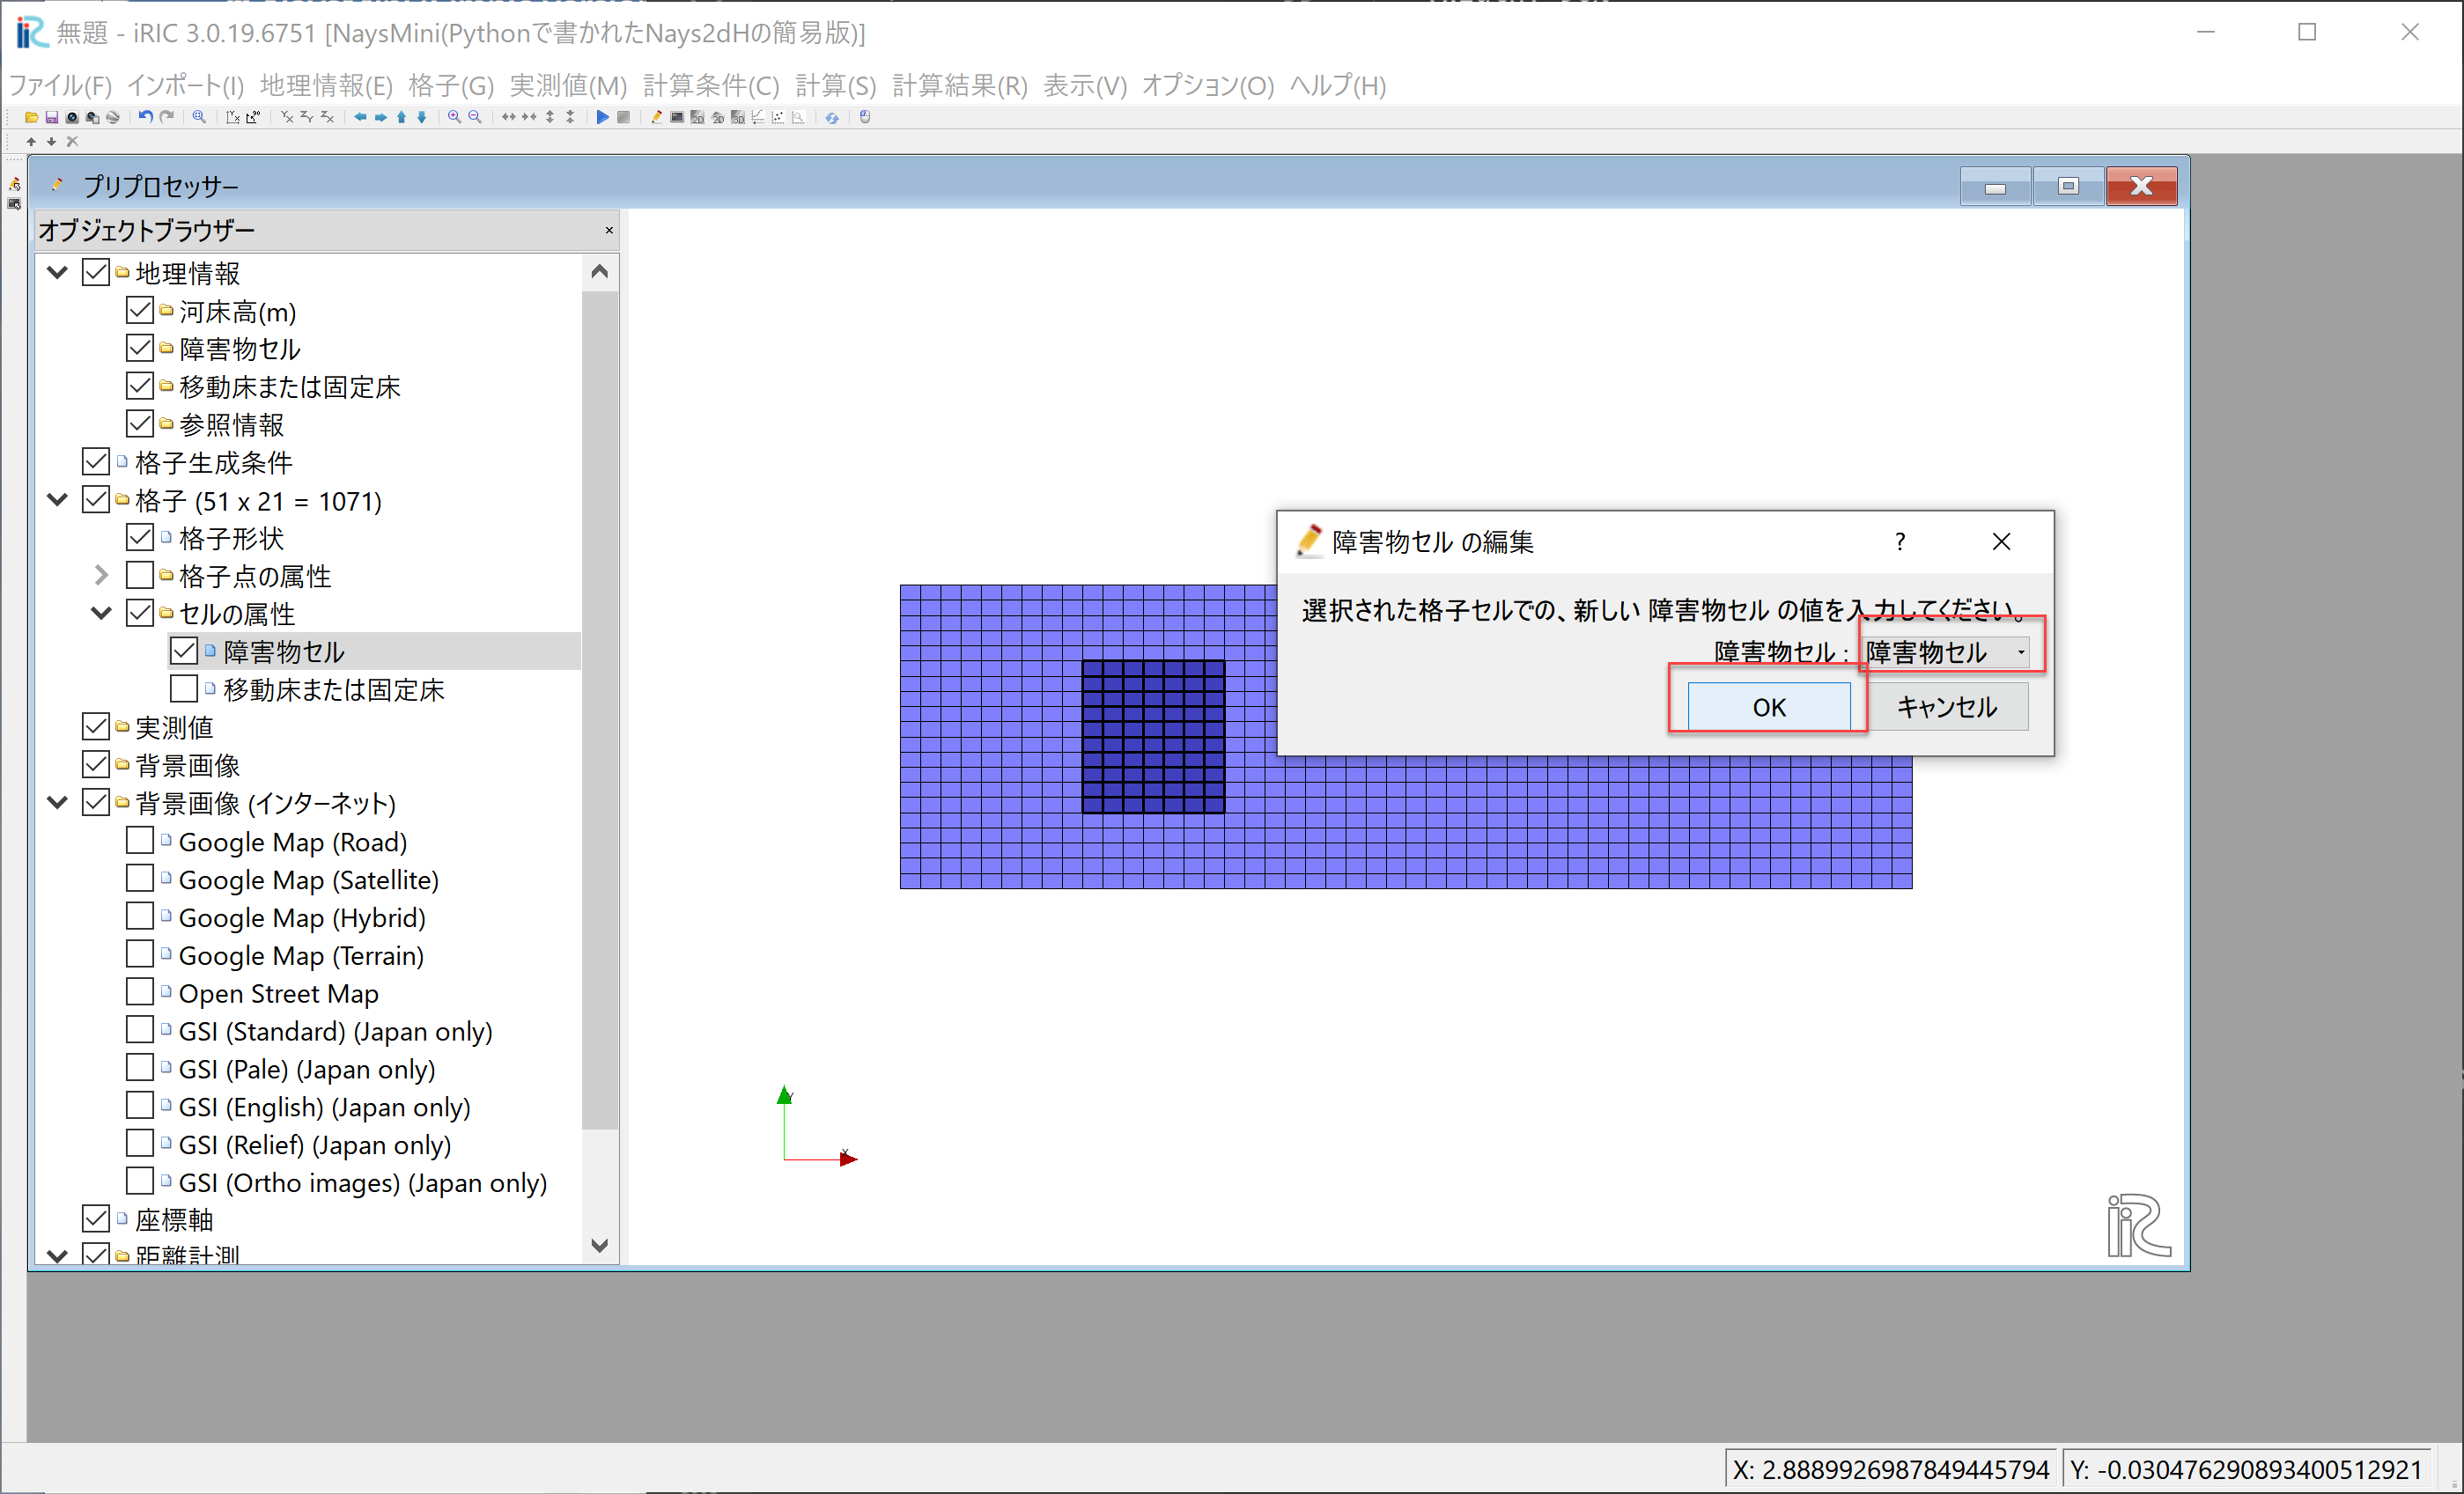
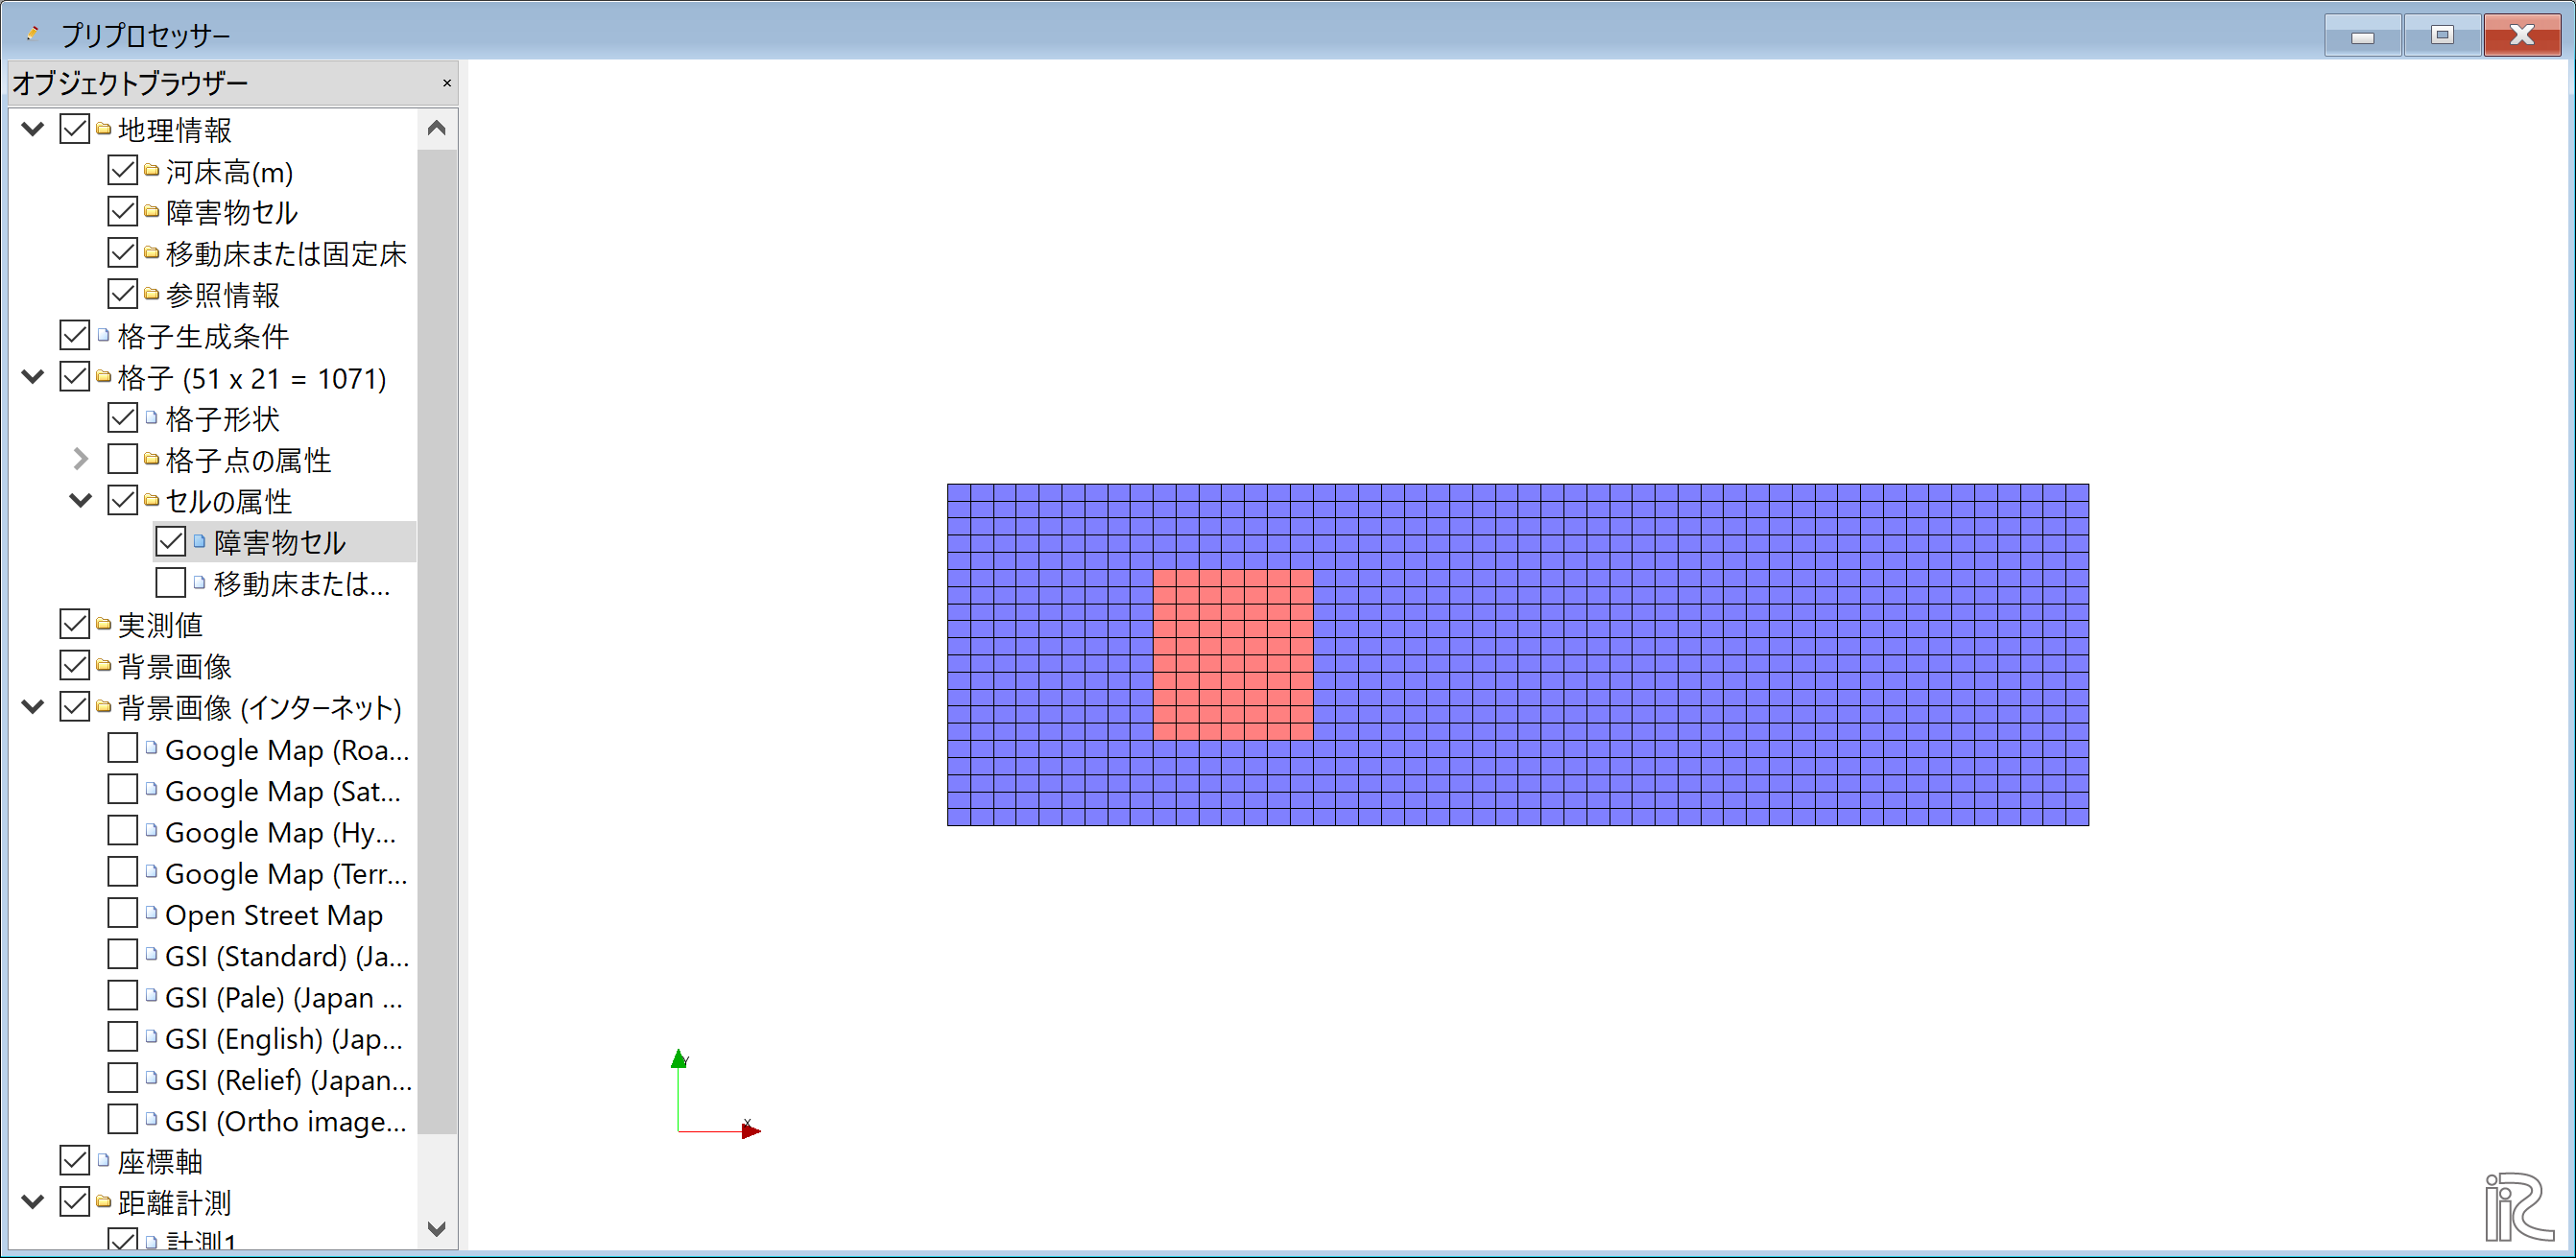
Figure 10 :障害物の設定(完了)
計算条件の設定
メインメニューから[計算条件]→[設定]を選択.(Figure 11 )
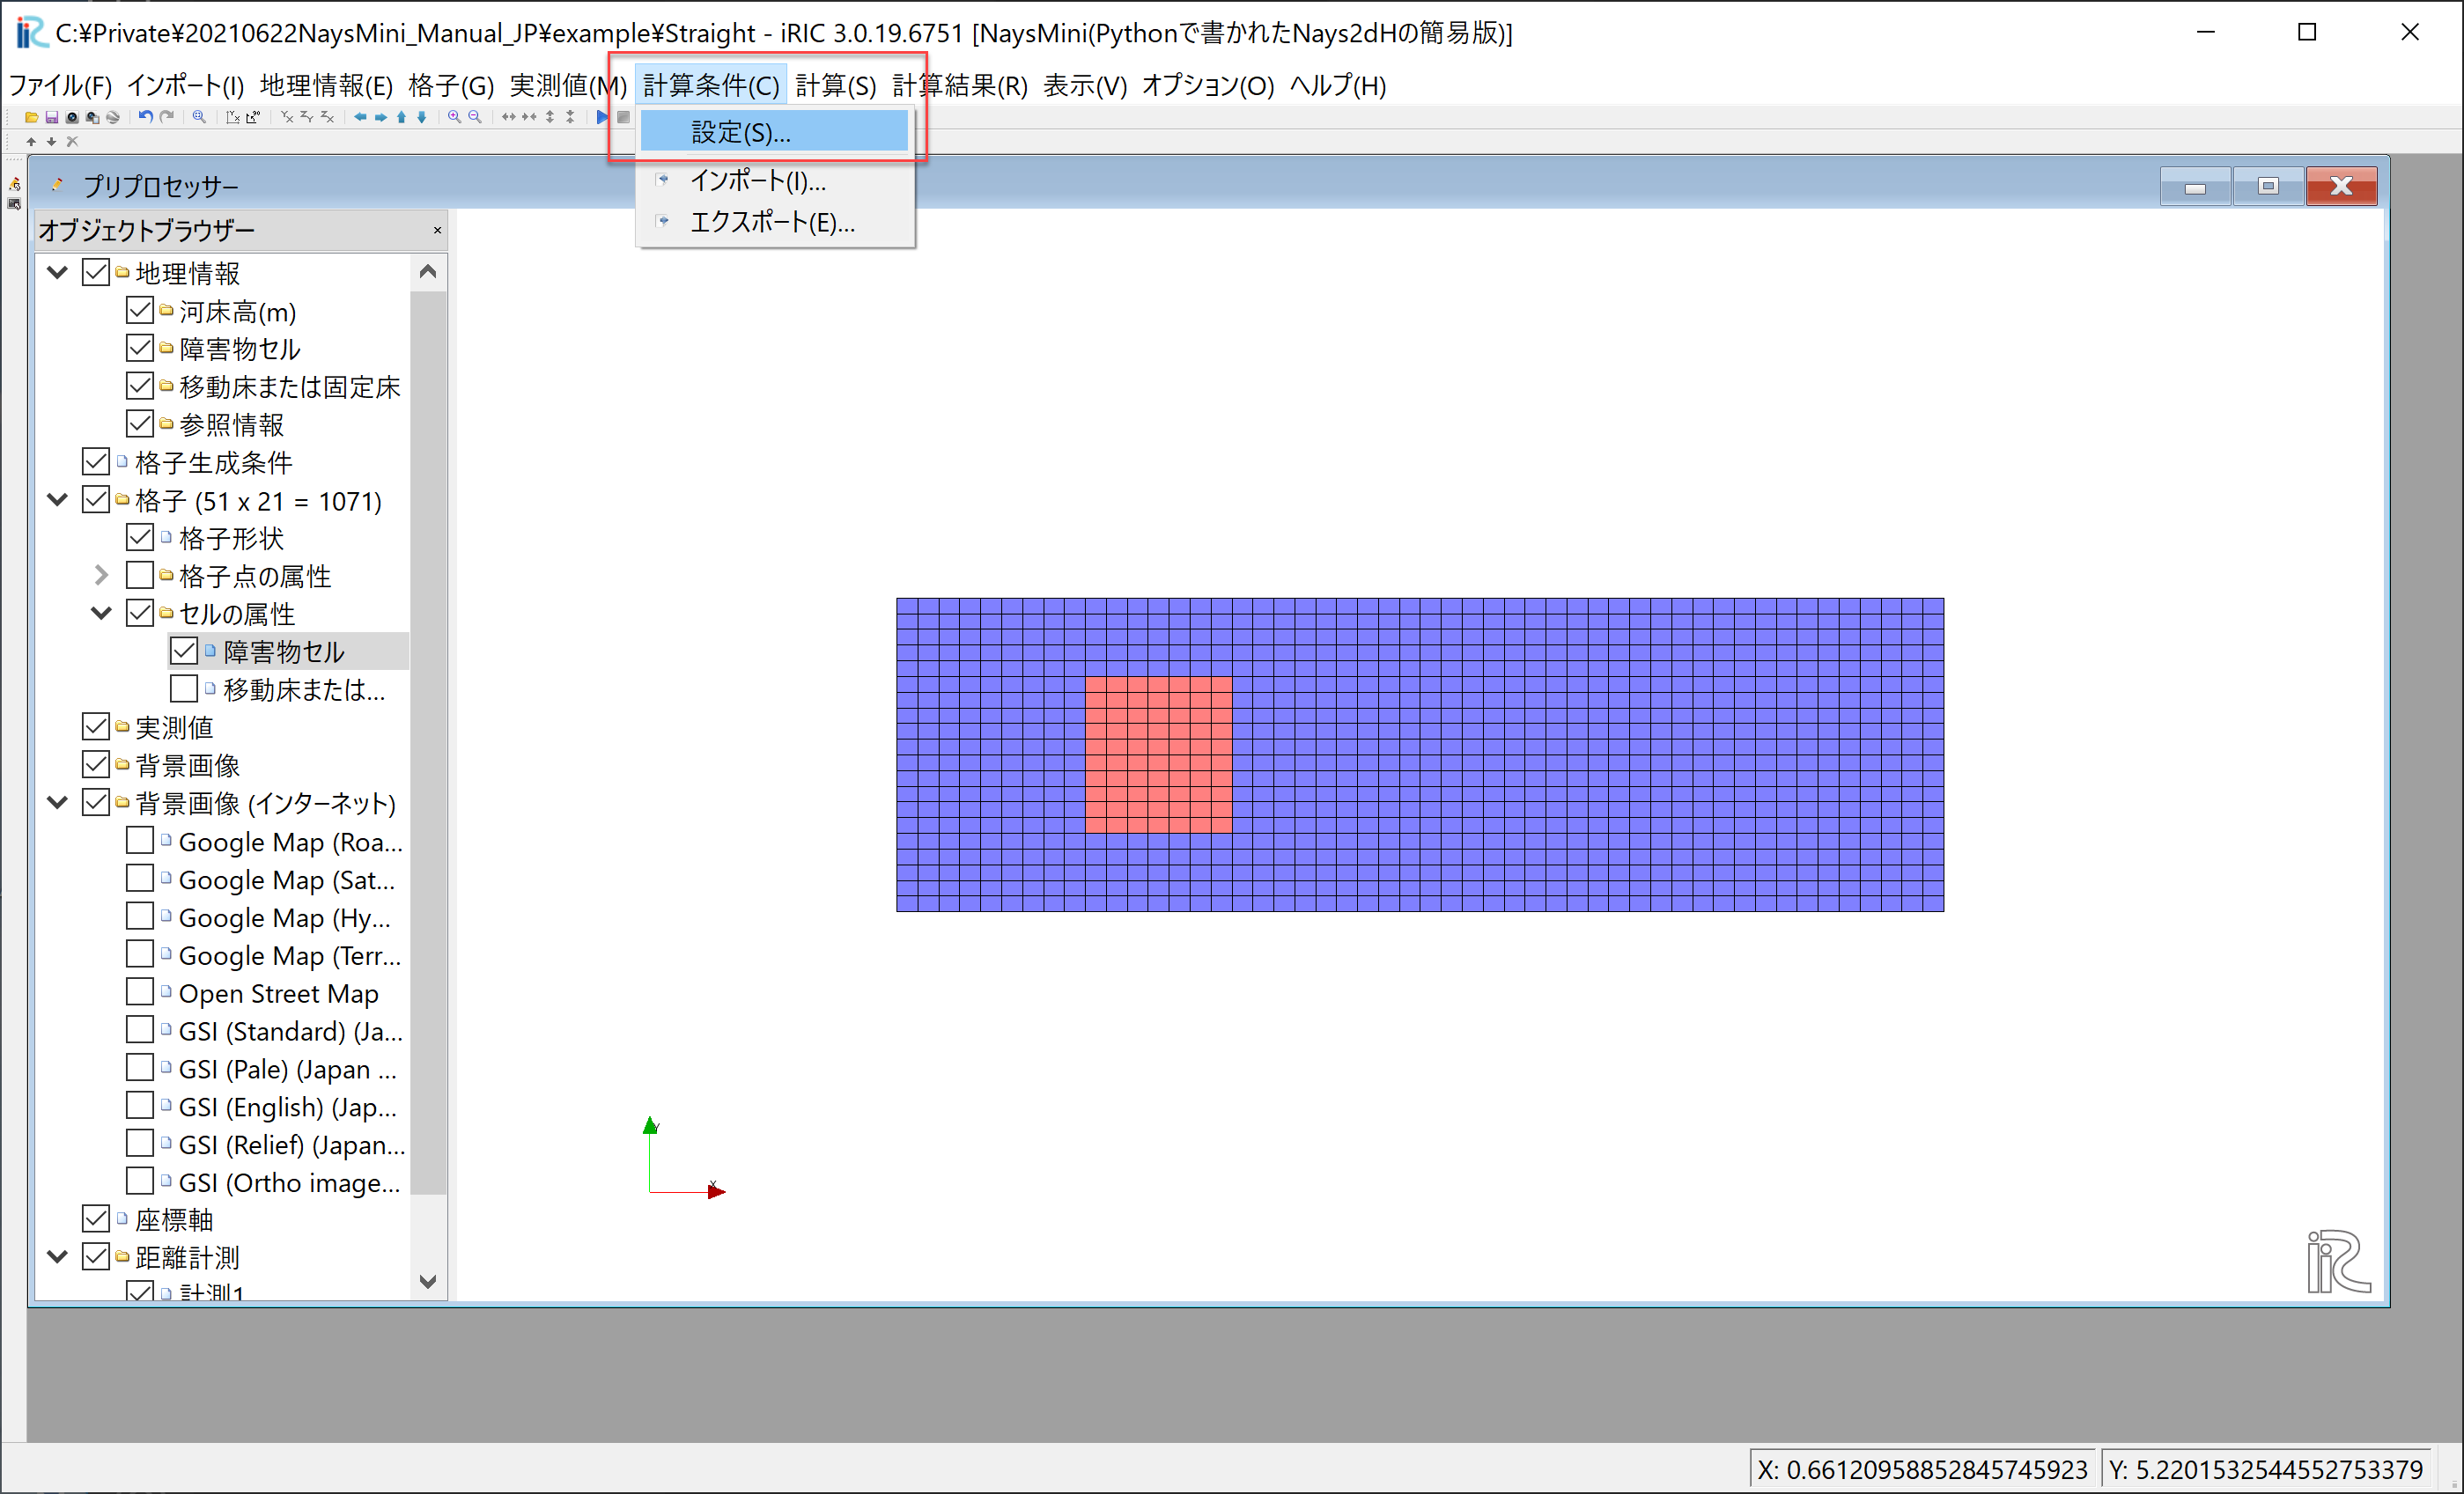
Figure 11 :計算条件の設定(1)
[計算条件]ウィンドウで,[水理条件および物理定数]を Figure 12 のように設定する.
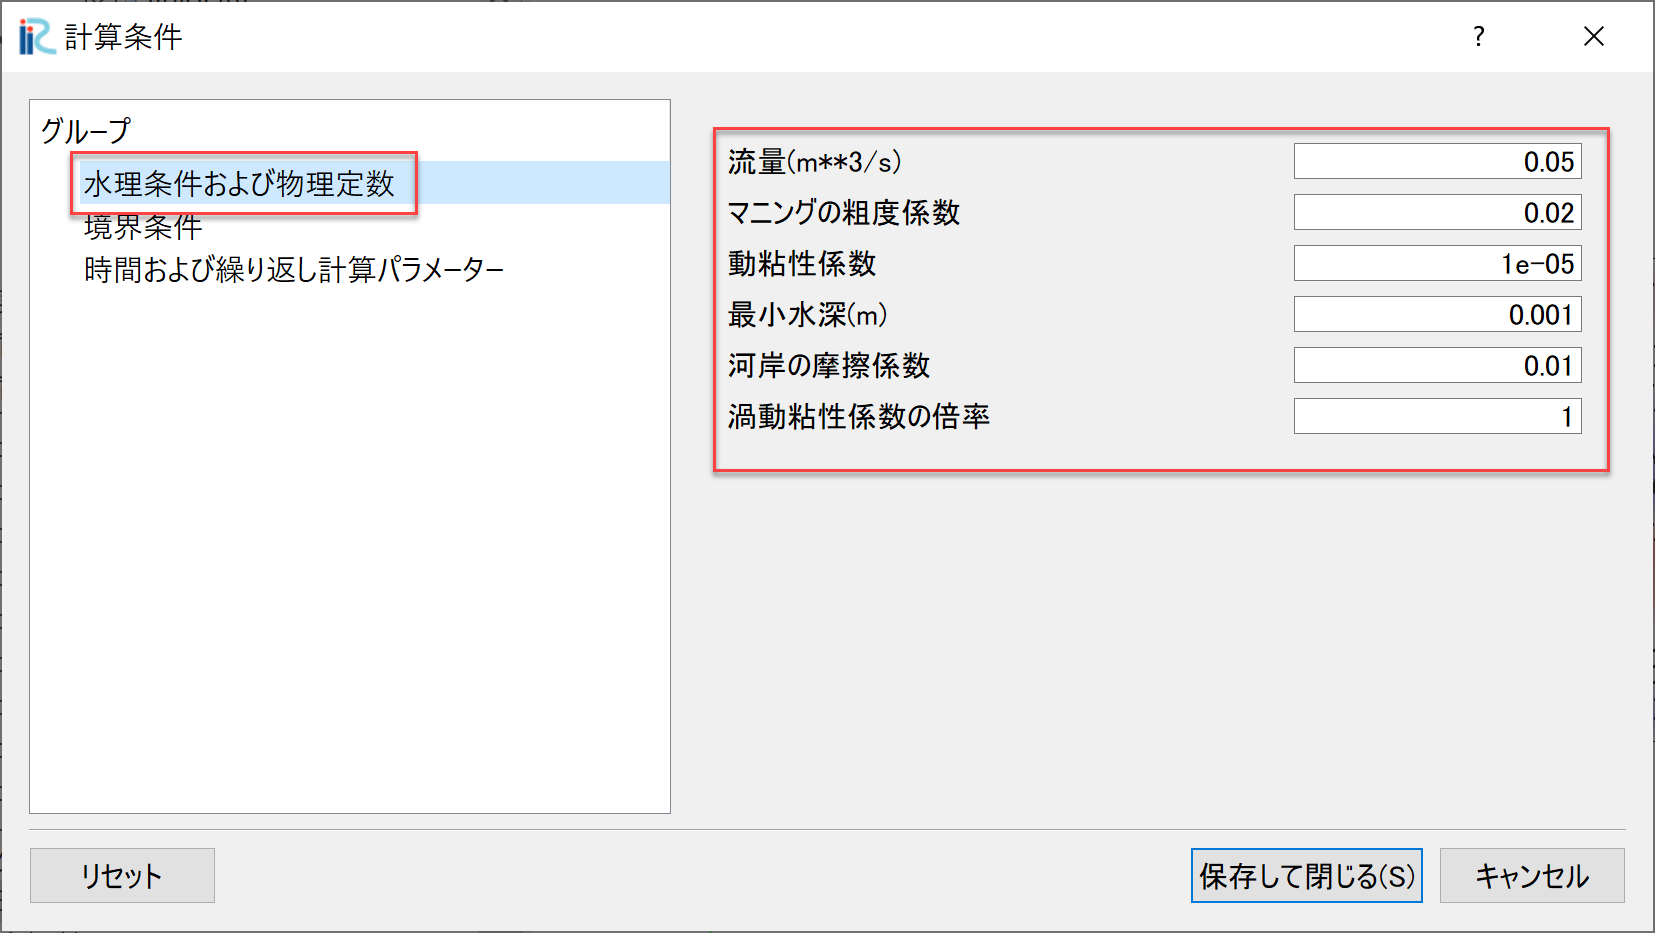
Figure 12 :計算条件の設定(2)
[計算条件]ウィンドウで,[境界条件]を Figure 13 のように設定する.
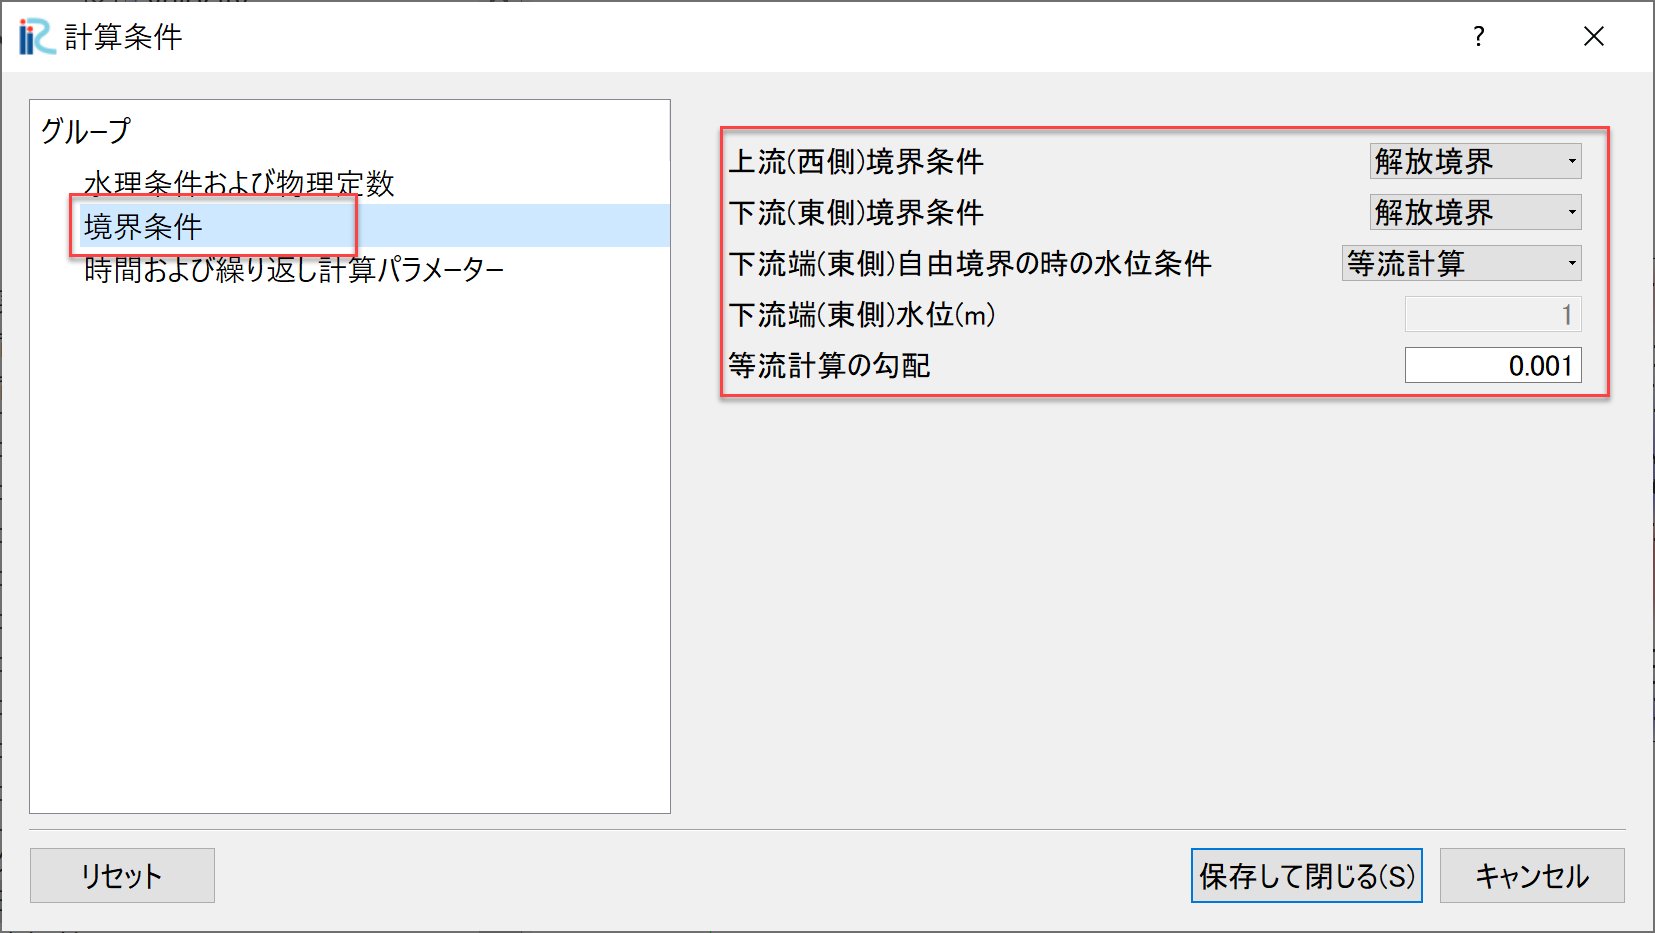
Figure 13 :計算条件の設定(3)
[計算条件]ウィンドウで,[時間および繰り返し計算パラメーター]]を Figure 14 のように設定し,[保存して閉じる]をクリック.
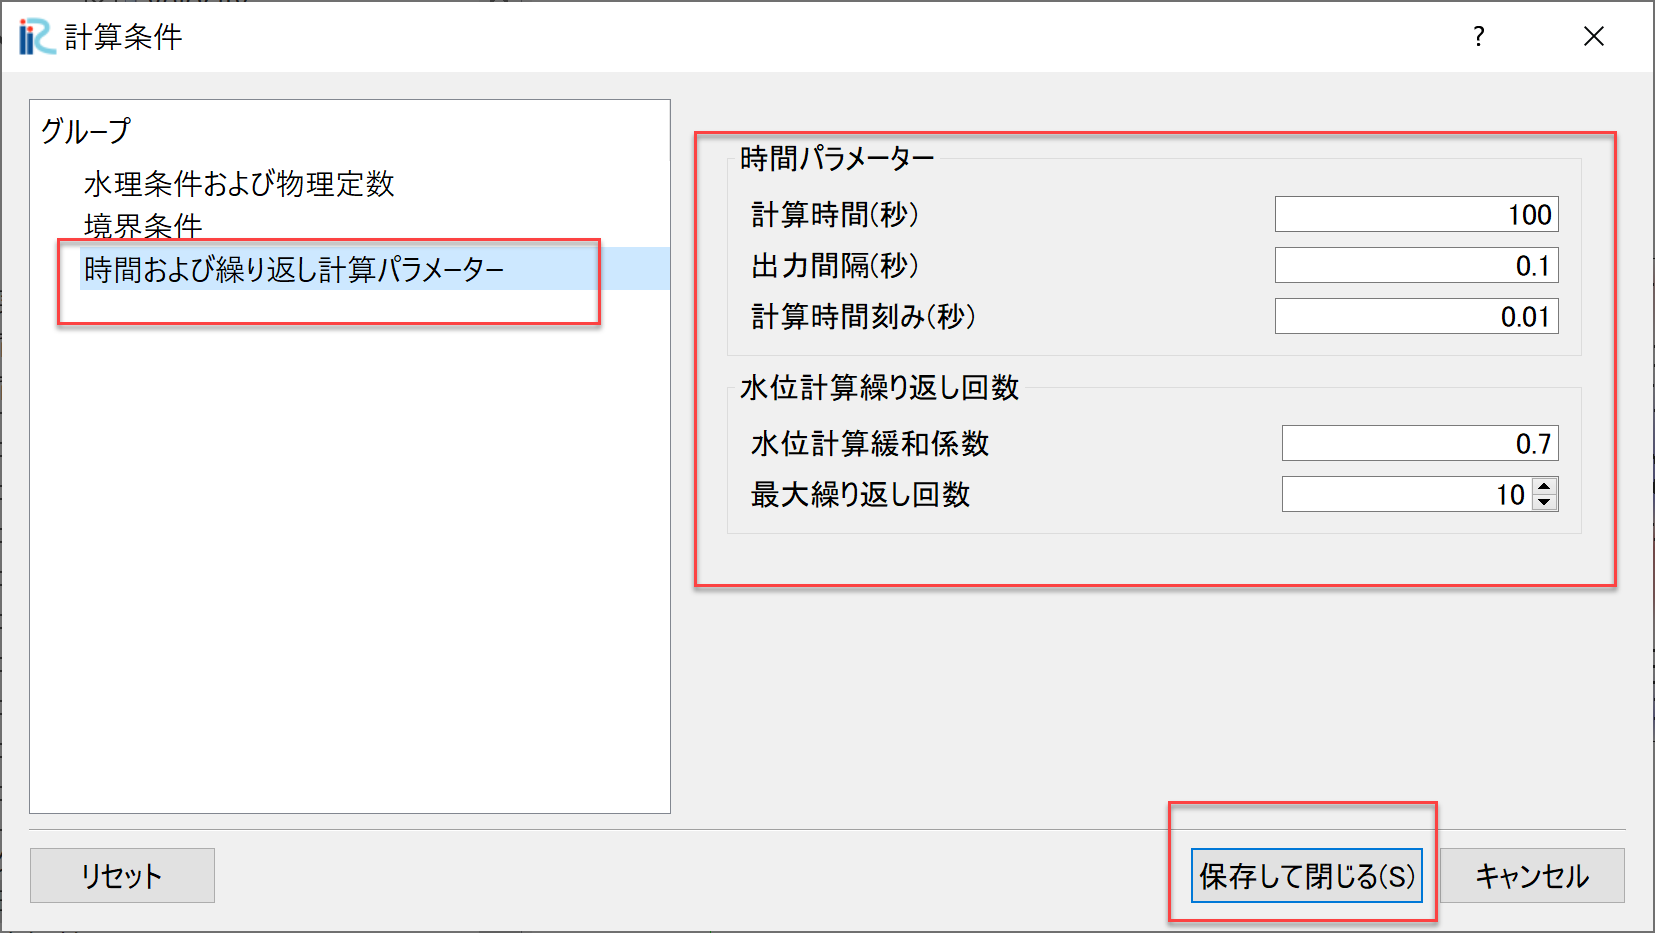
Figure 14 :計算条件の設定(4)
計算の実行
メインメニューから[計算]→[実行]を選択.
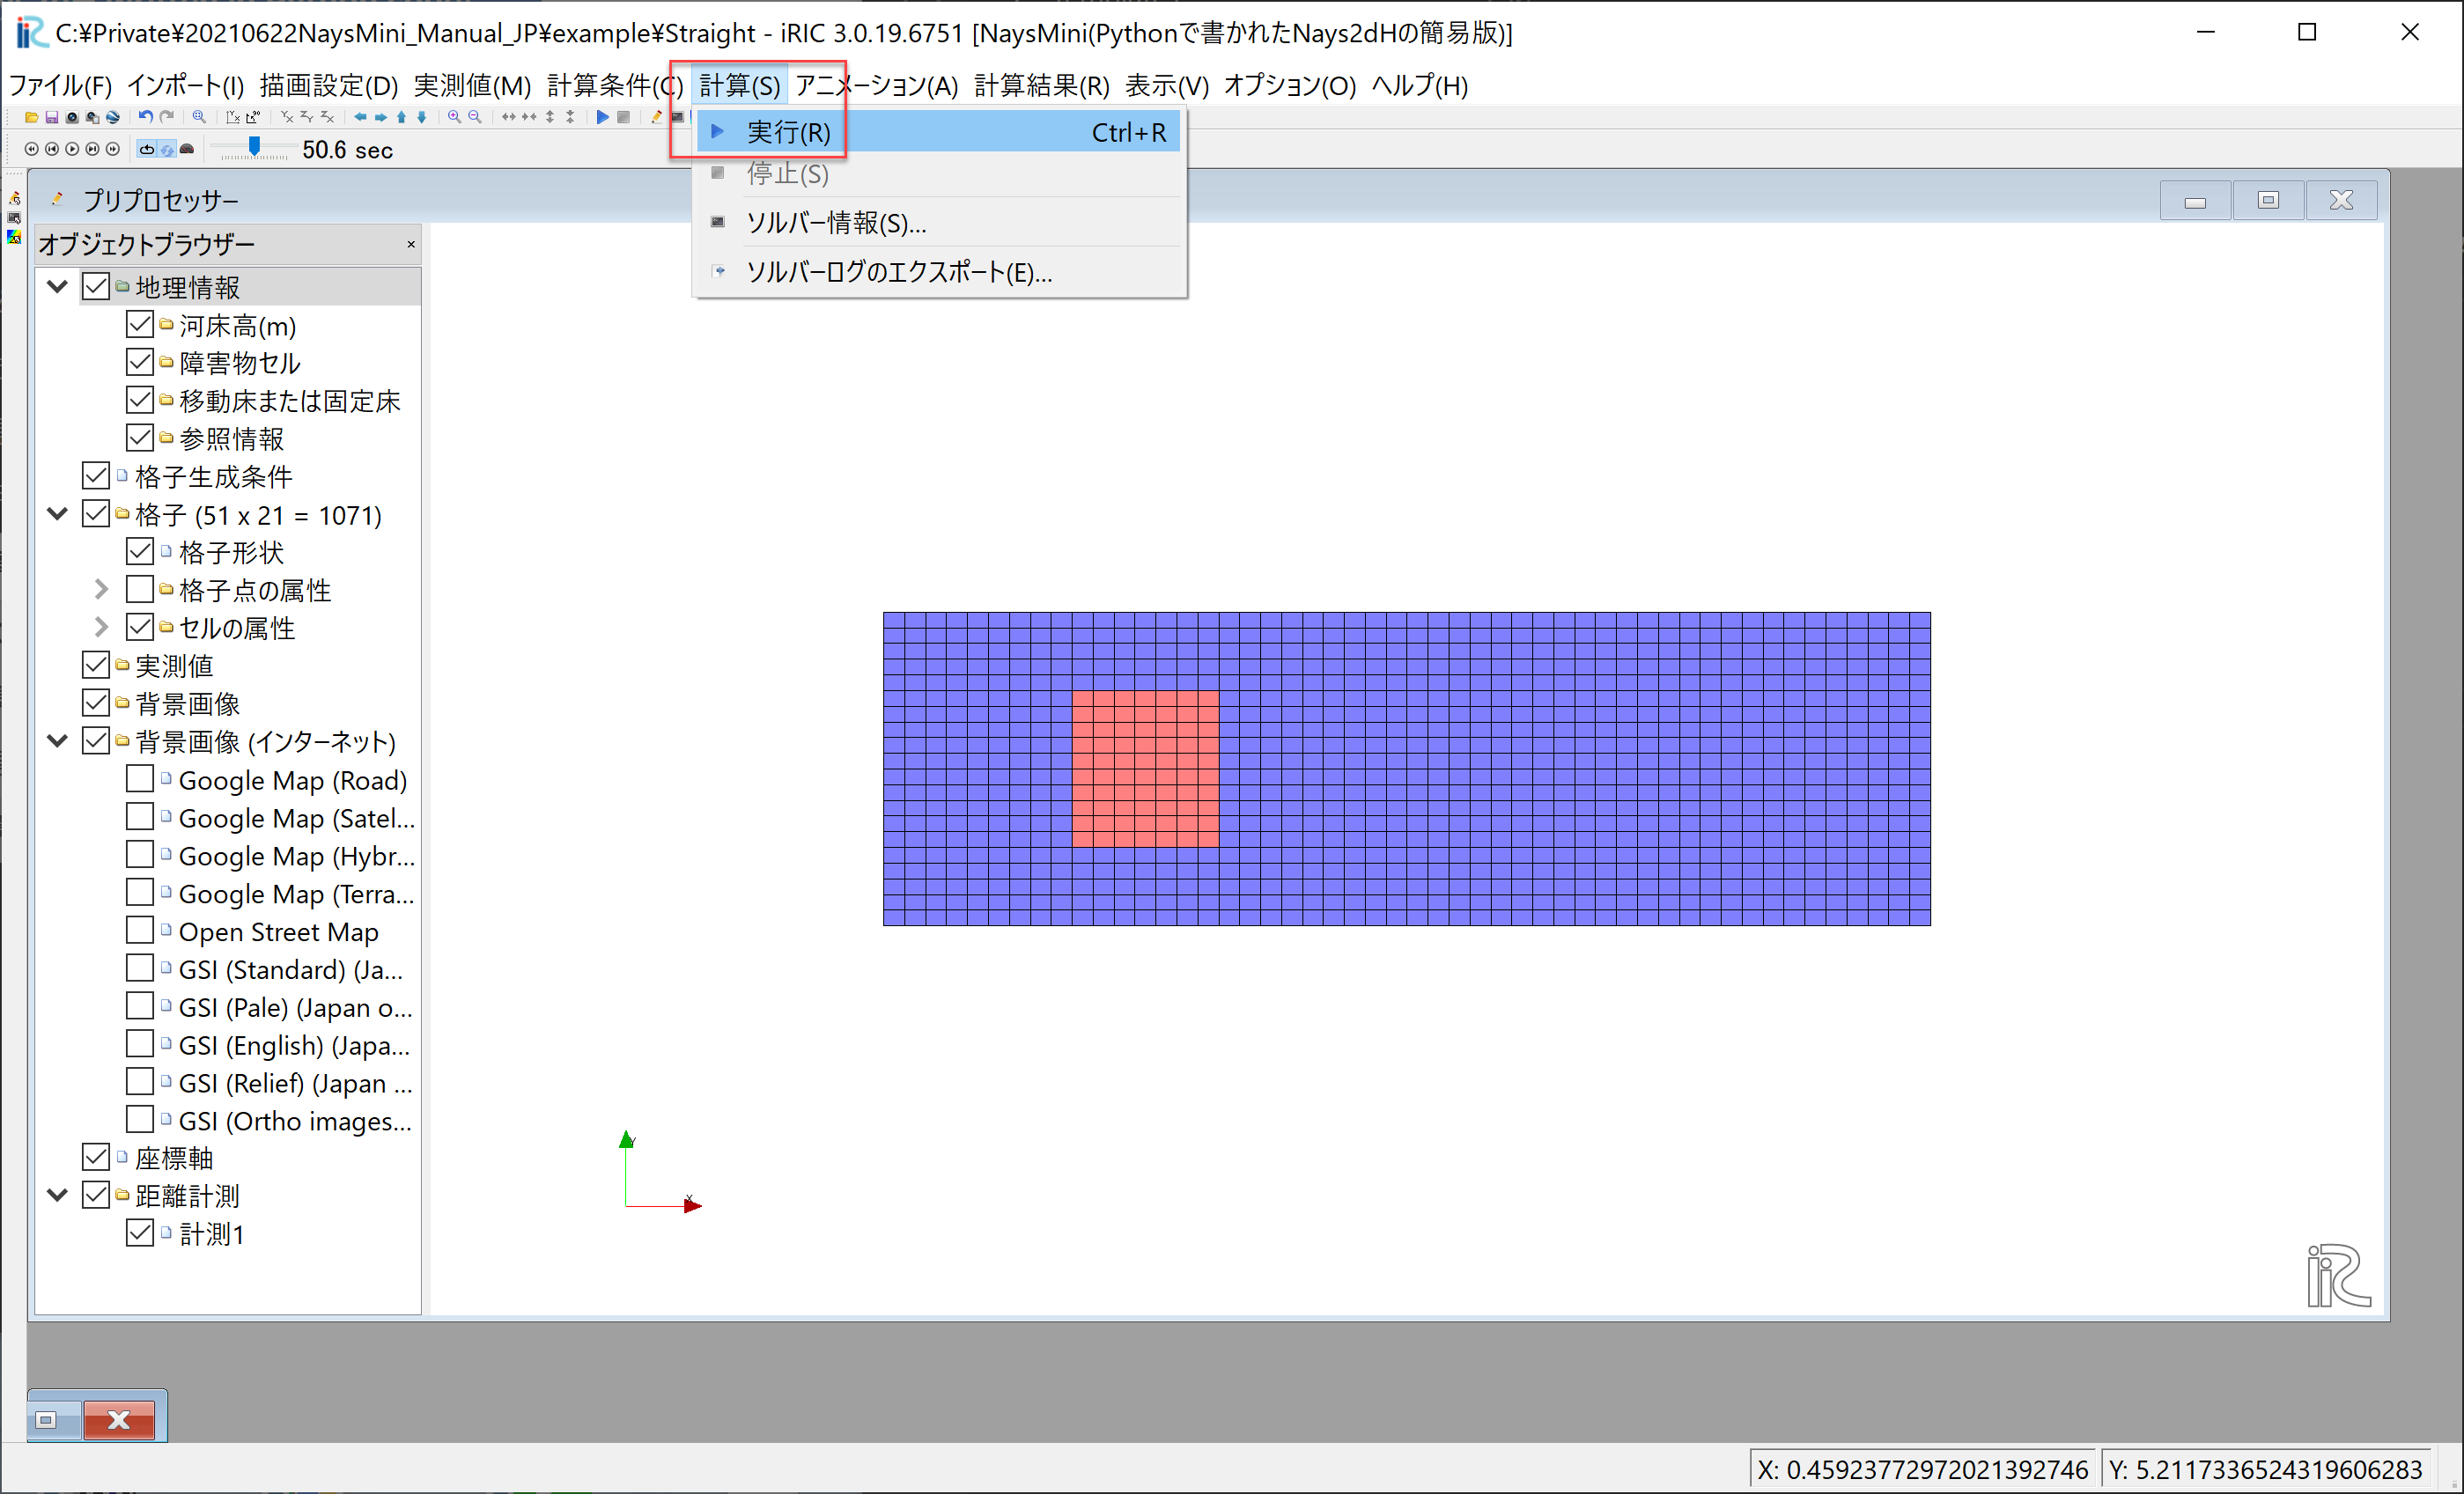
Figure 15 :計算の実行(1)
プロジェクトを保存するか聞かれるので通常は[はい]を選択して,プロジェクトを保存する.
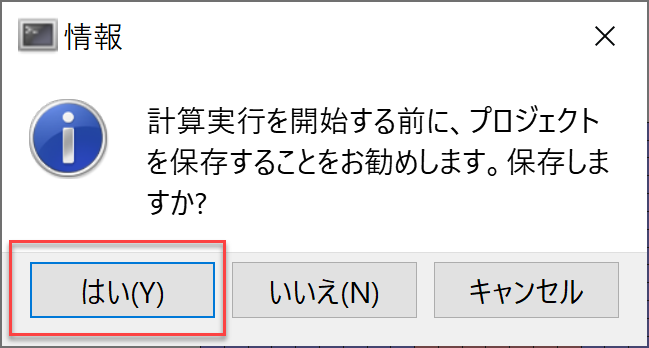
Figure 16 :計算の実行(2)
Figure 17 のコンソールウィンドウが出て計算が実行される.
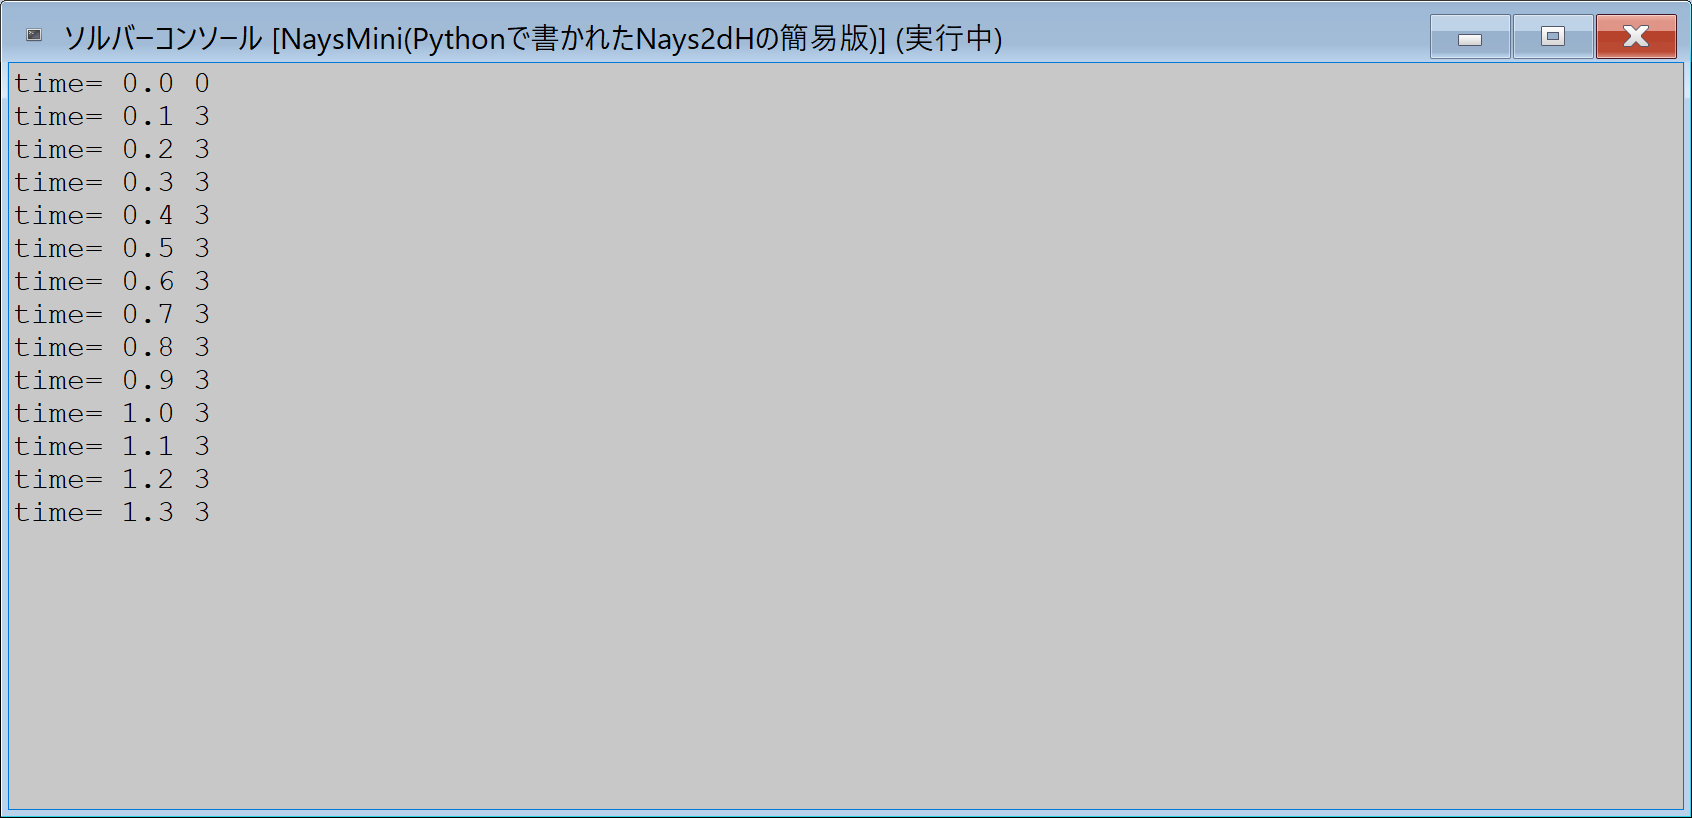
Figure 17 :計算の実行(3)
計算が終了すると「ソルバーの計算が終了しました」と表示されるので,[OK]を押す.
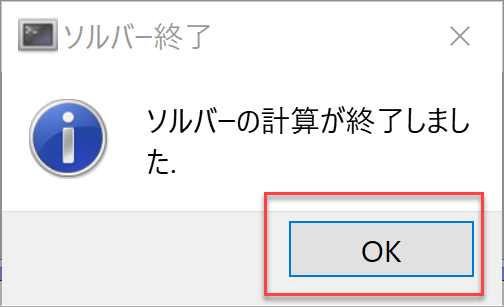
Figure 18 :計算の実行(4)
計算結果の表示
メインメニューから[計算結果]→[新しい可視化ウィンドウ(2D)を開く] を選択する.
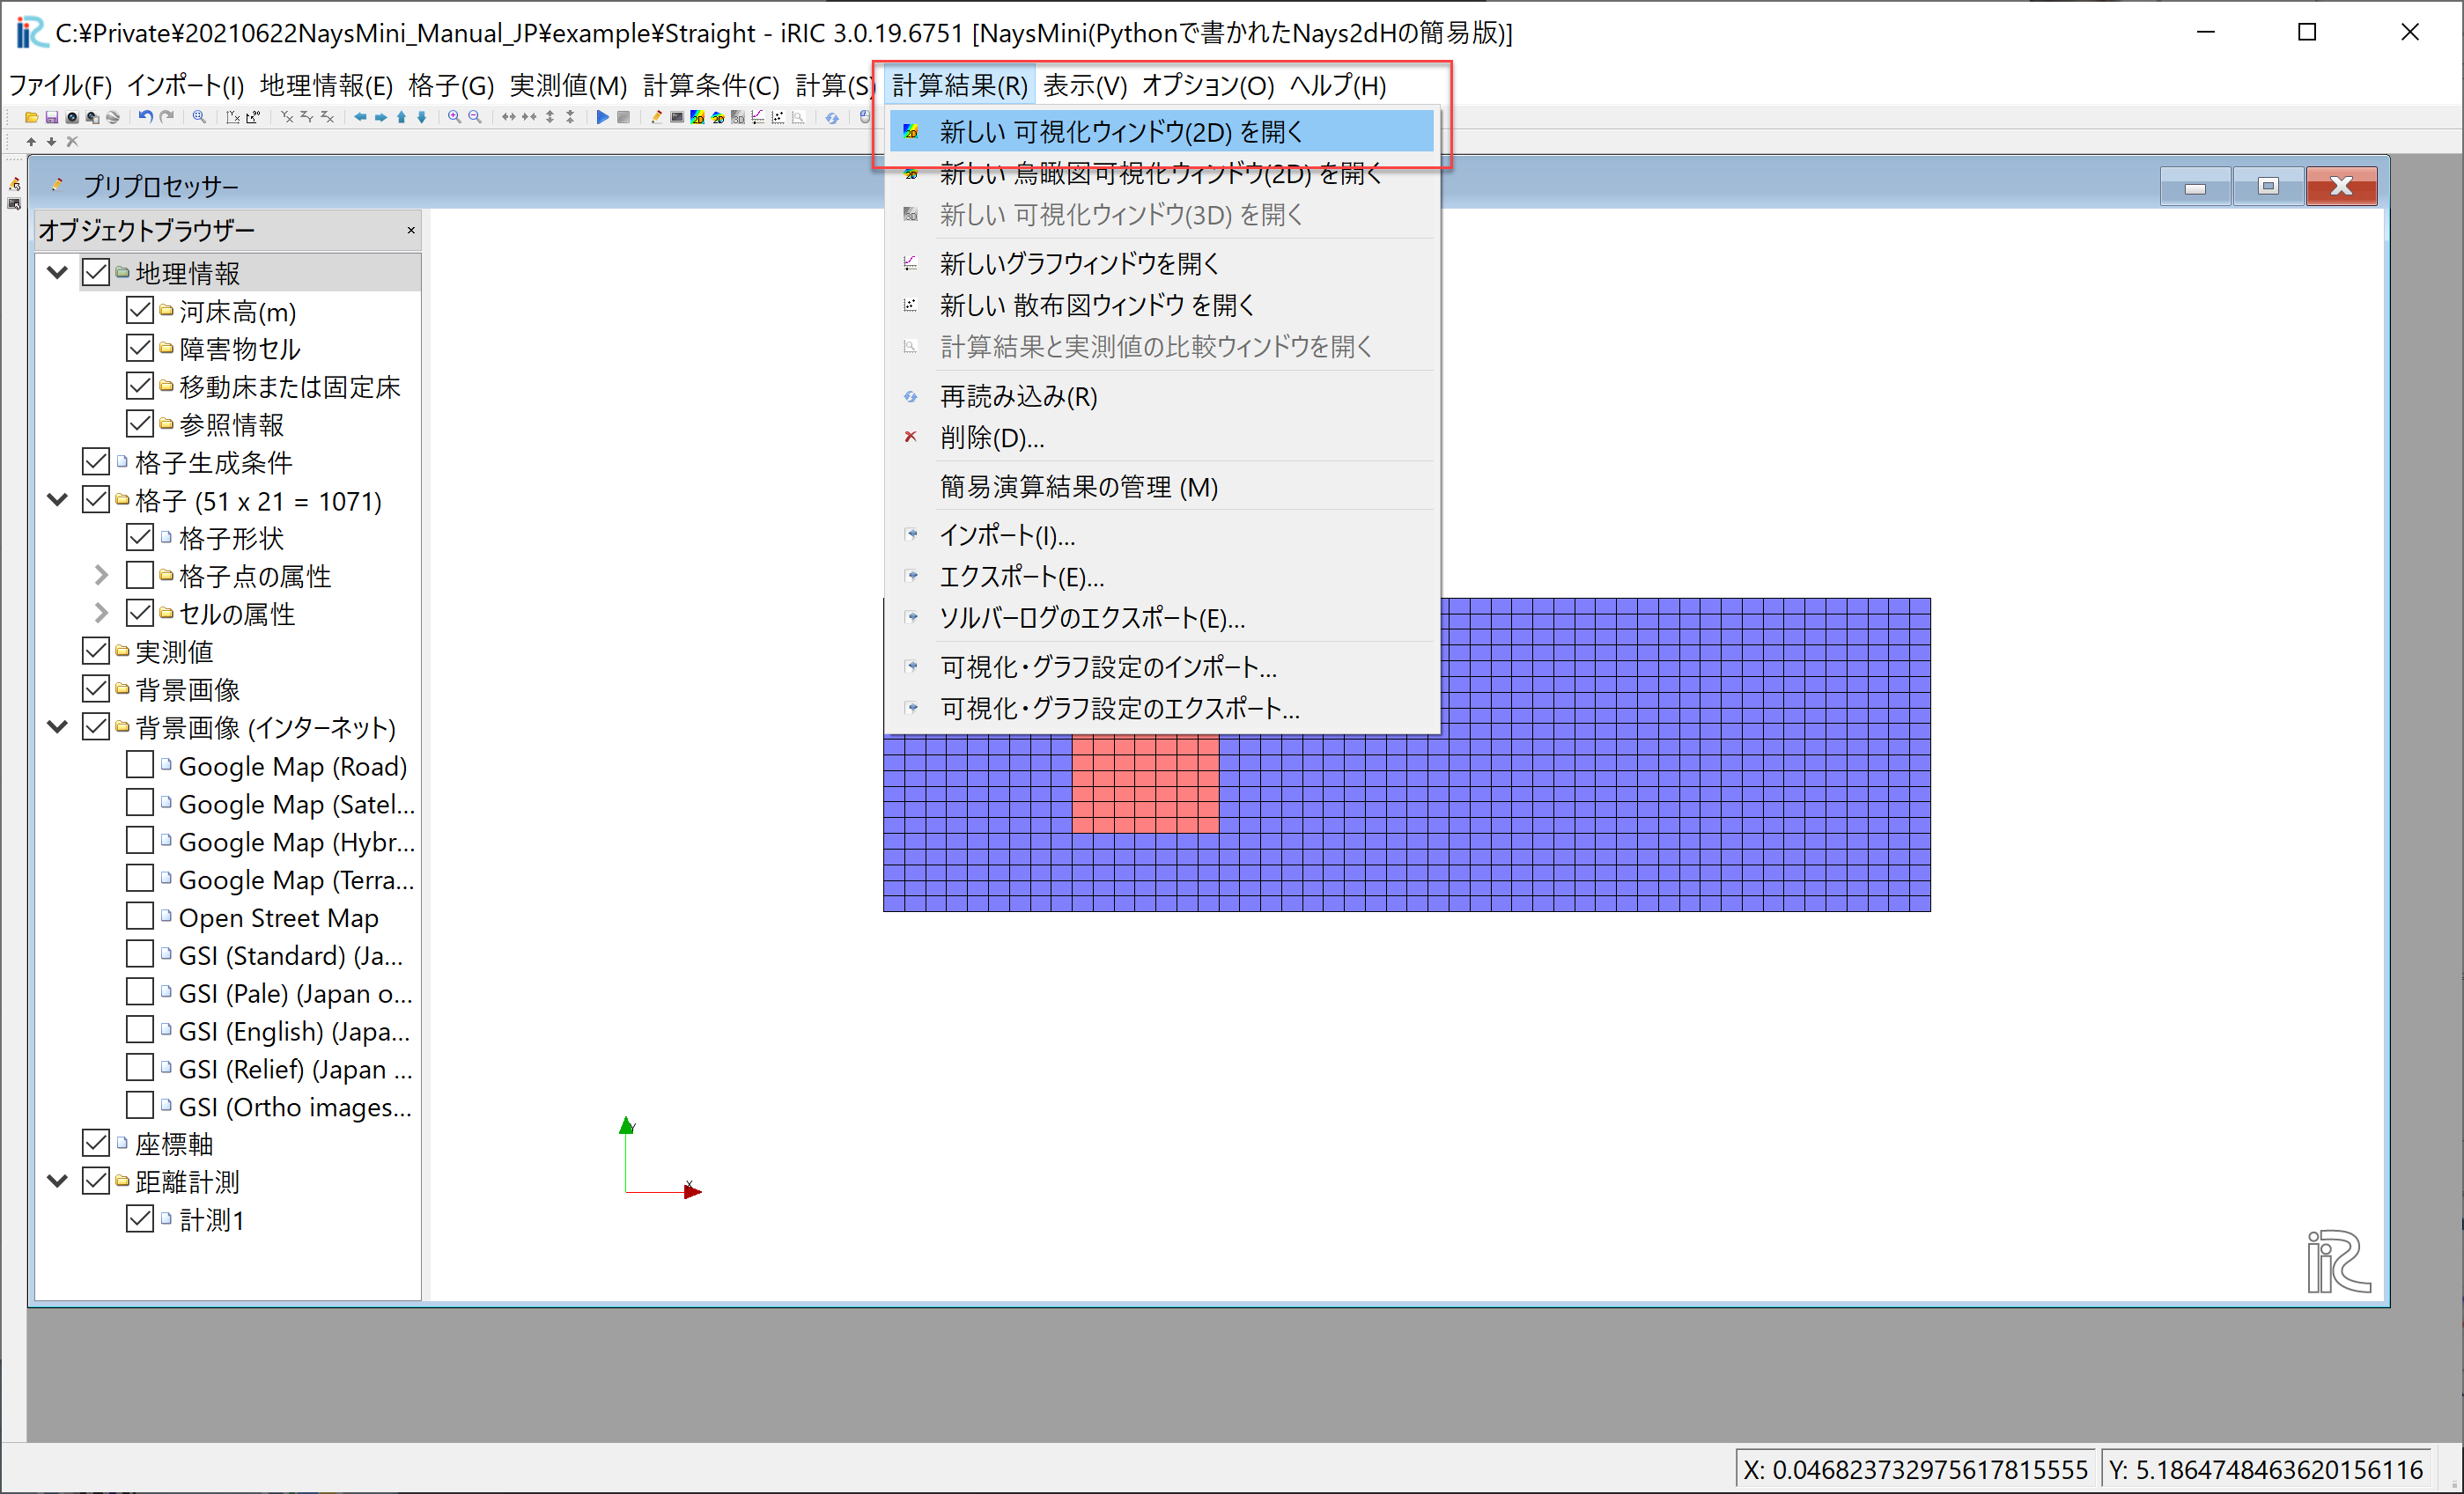
Figure 19 :計算結果の表示(1)
[可視化ウィンドウ(2D)]が表示される.
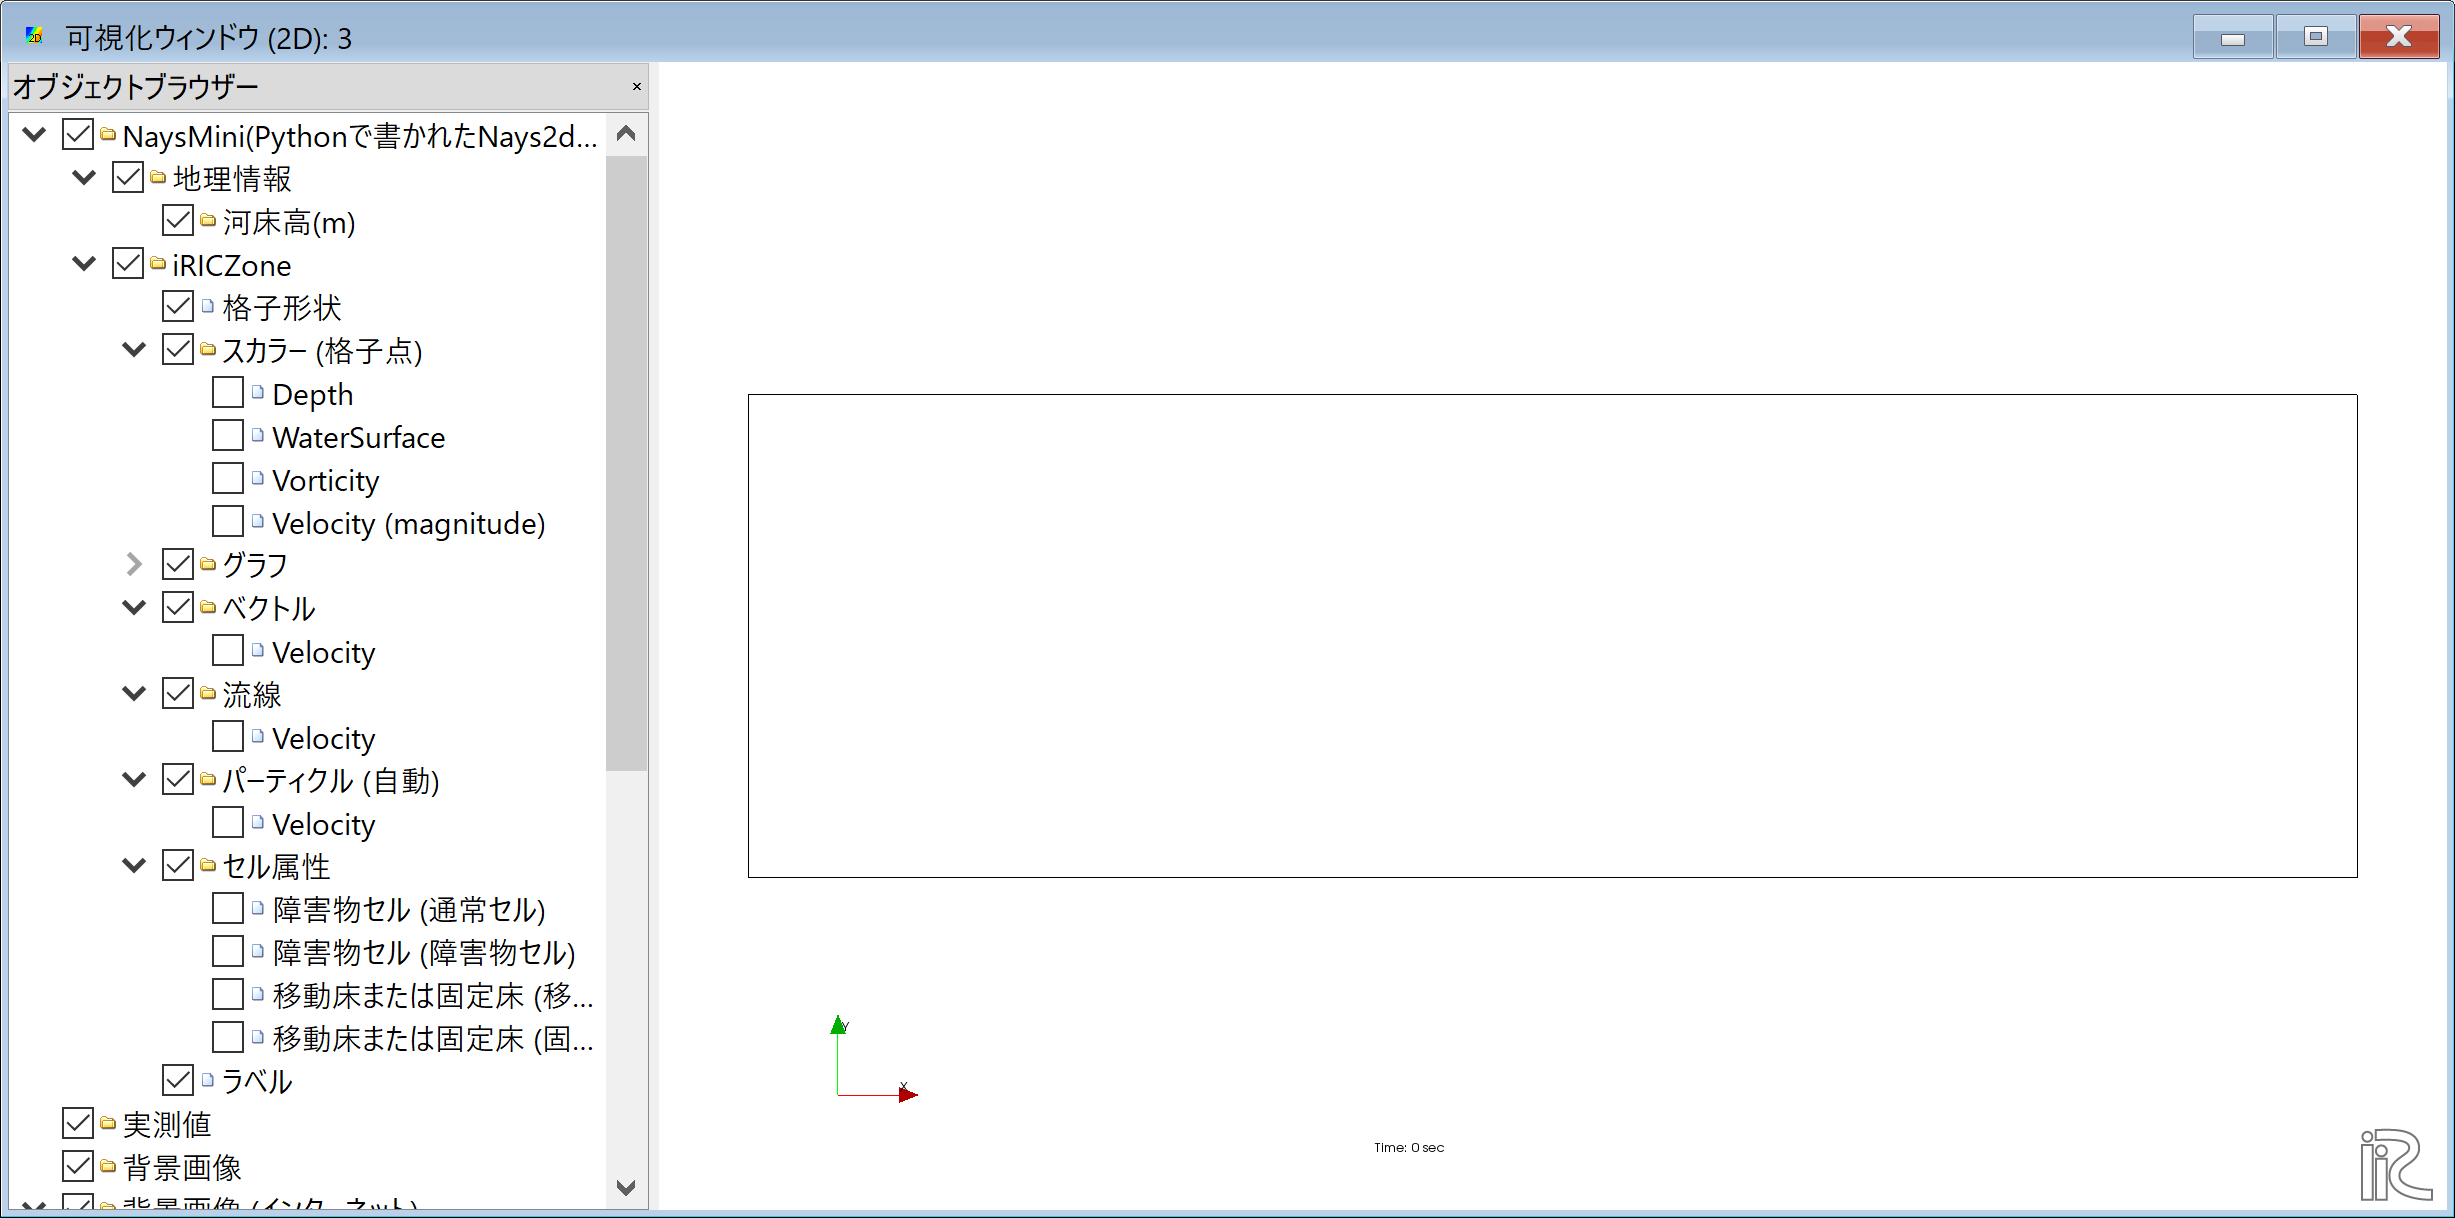
Figure 20 :計算結果の表示(2)
[オブジェクトブラウザー]で[セル属性]と[障害物セル(障害物セル)]に☑マークを入れると, 障害物の部分が Figure 21 のように色が変わる.
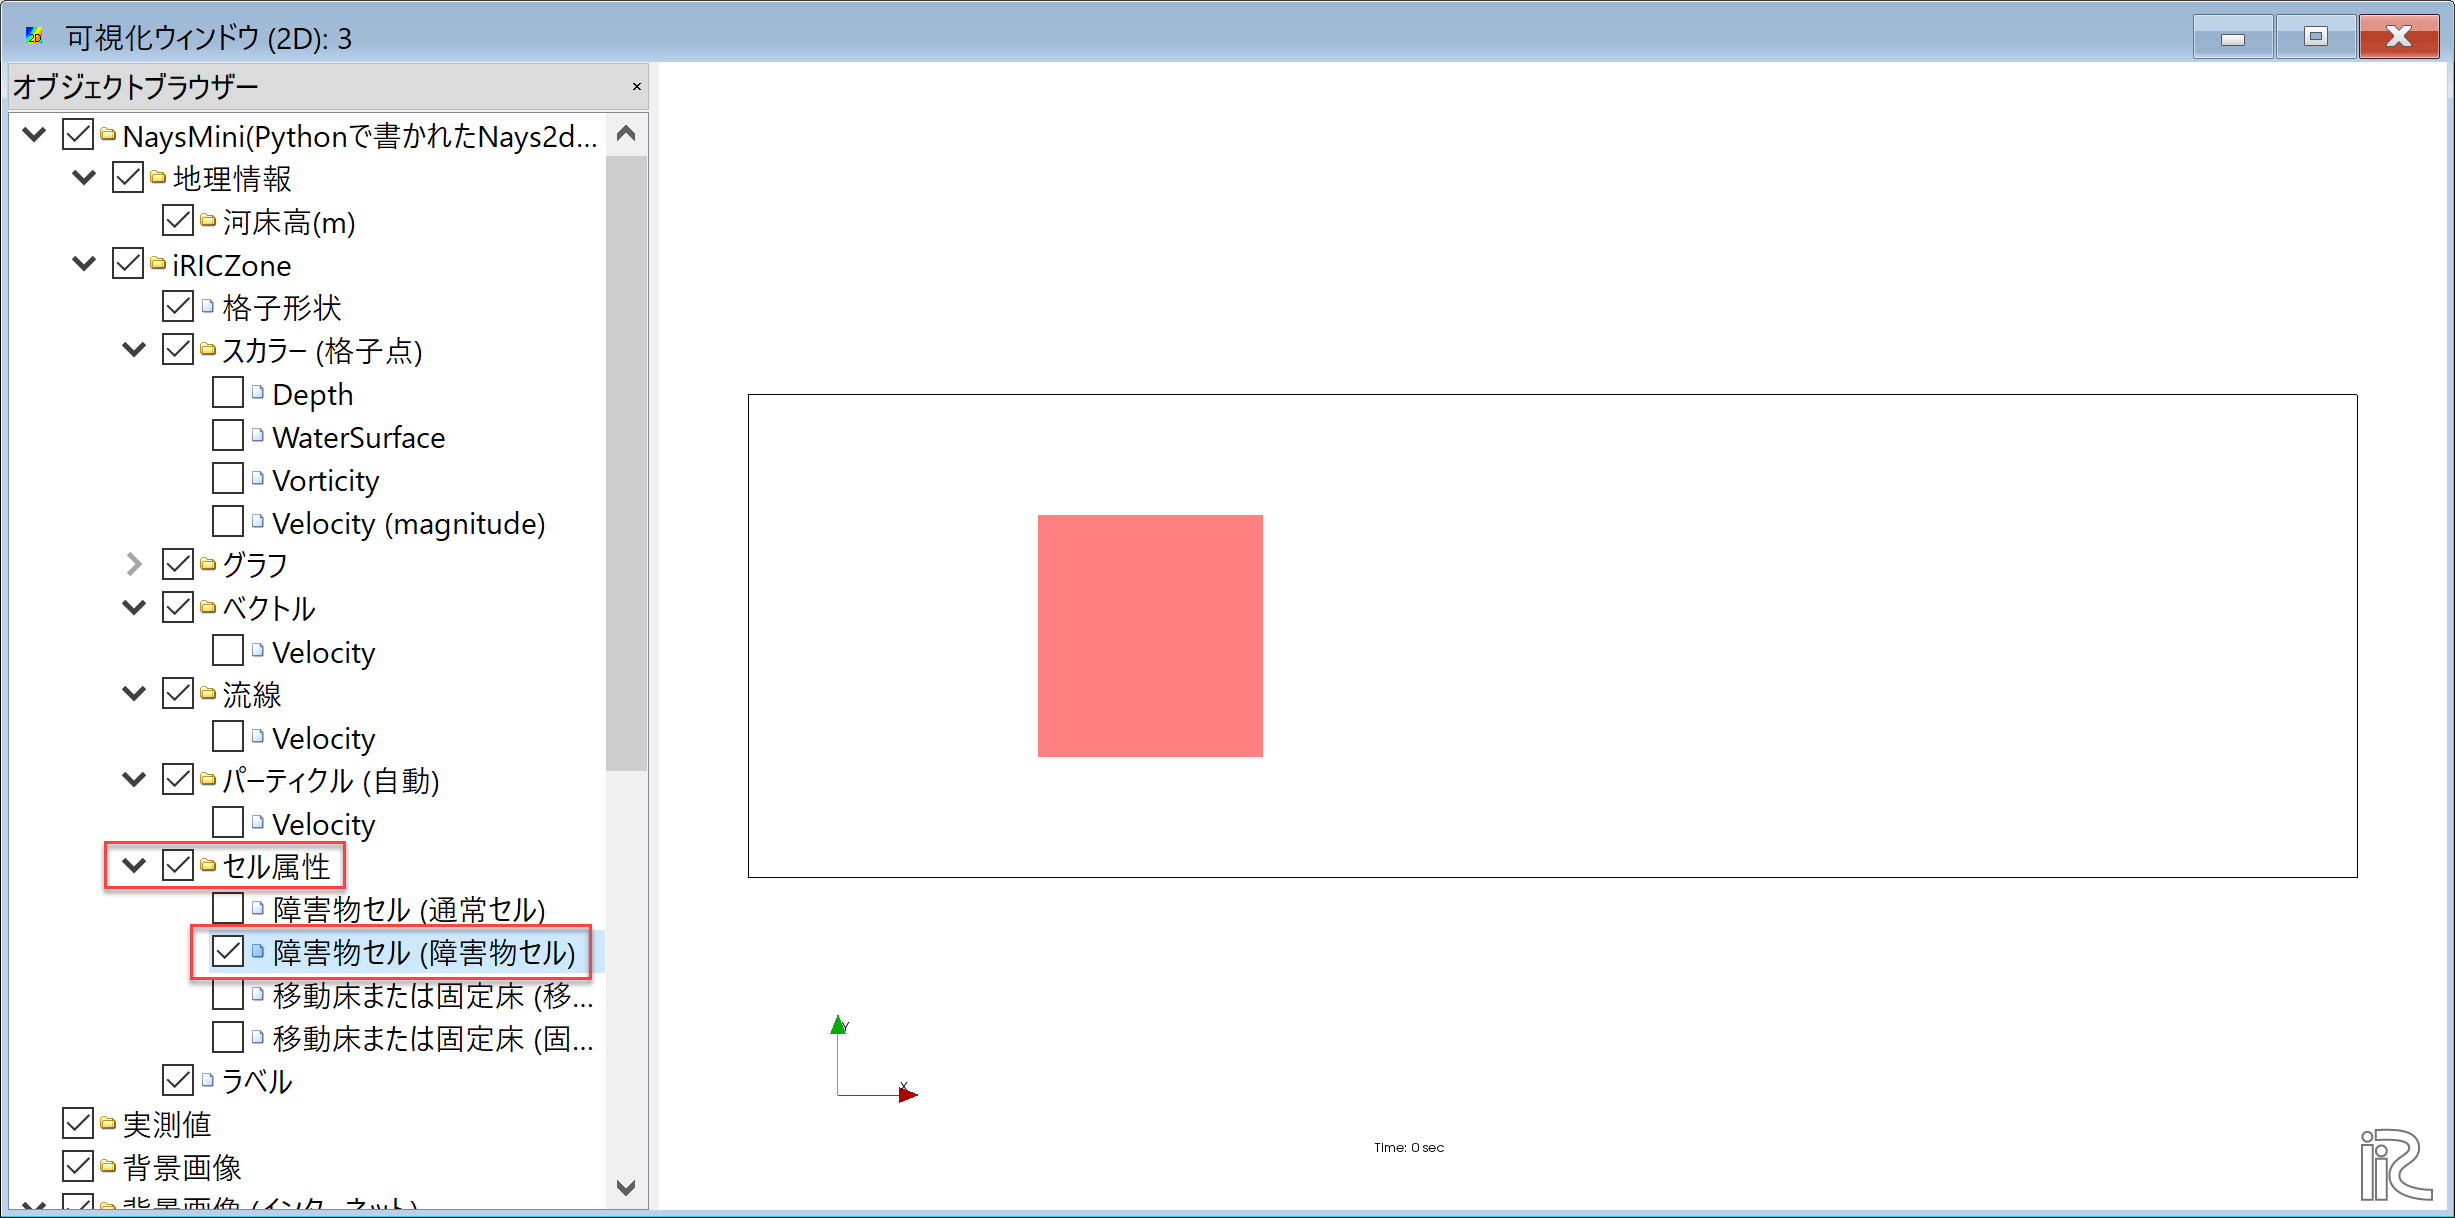
Figure 21 :計算結果の表示(3)
[オブジェクトブラウザー]で[スカラー(格子点)]と[Vorticity]に☑マークを入れて,[Vorticity]を右クリックして, [プロパティ]を選択する( Figure 22 ).なお.[Vorticity]は 渦度 のことで,次式で求められる水平渦の強度である.
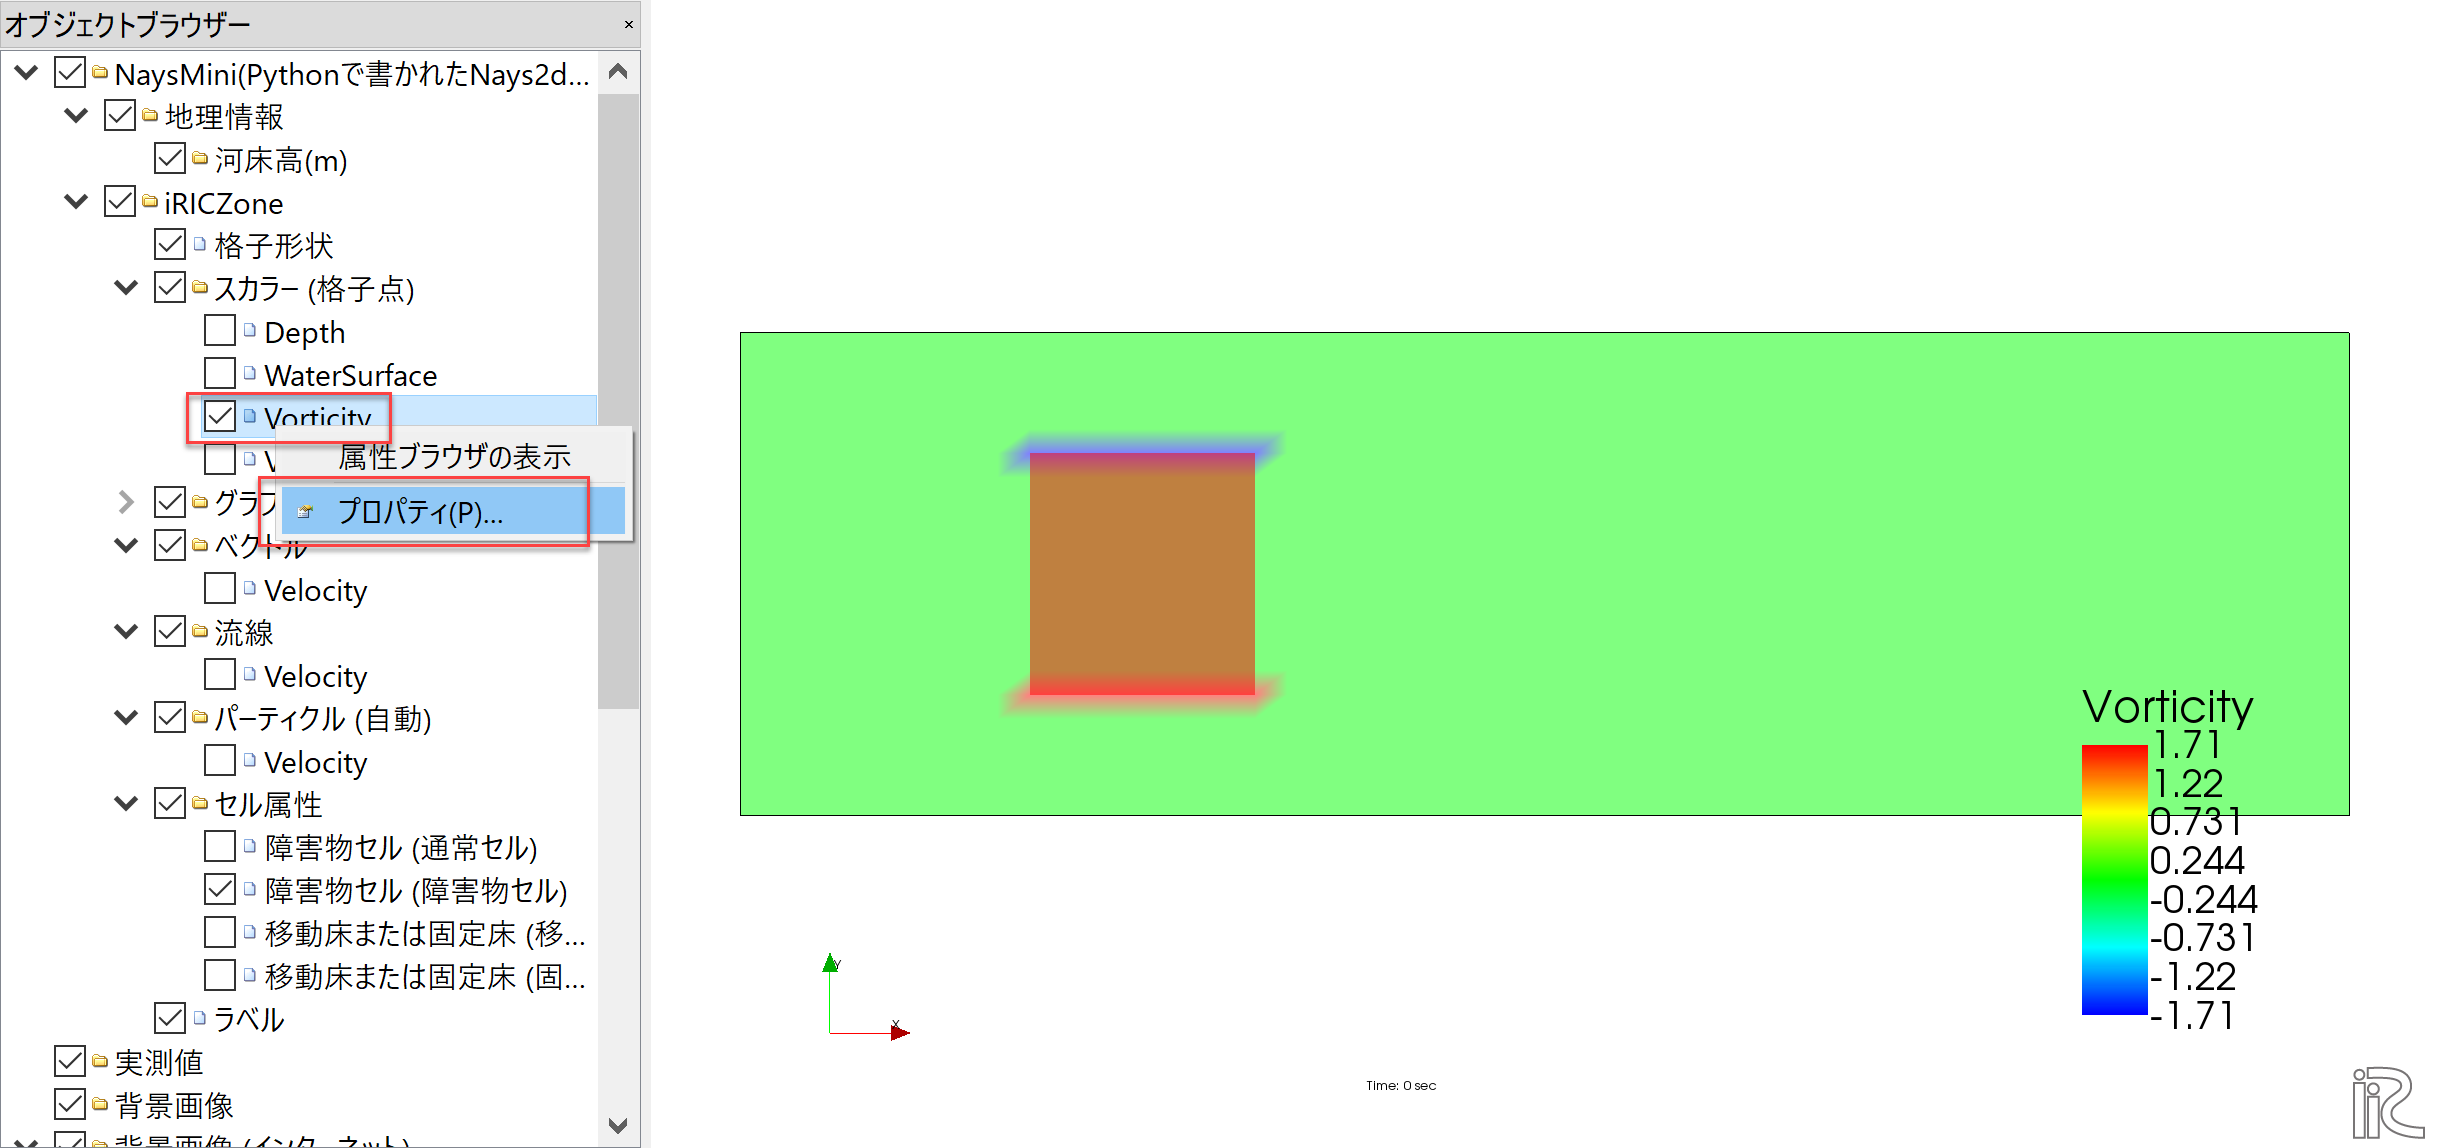
Figure 22 :計算結果の表示(4)
[スカラー設定]ウィンドウで,[物理量:], [値の範囲]の[自動]の前にある☑マークを外し, [最大値]および[最小値]をそれぞれ[2]と[-2]に設定する( Figure 23 ).
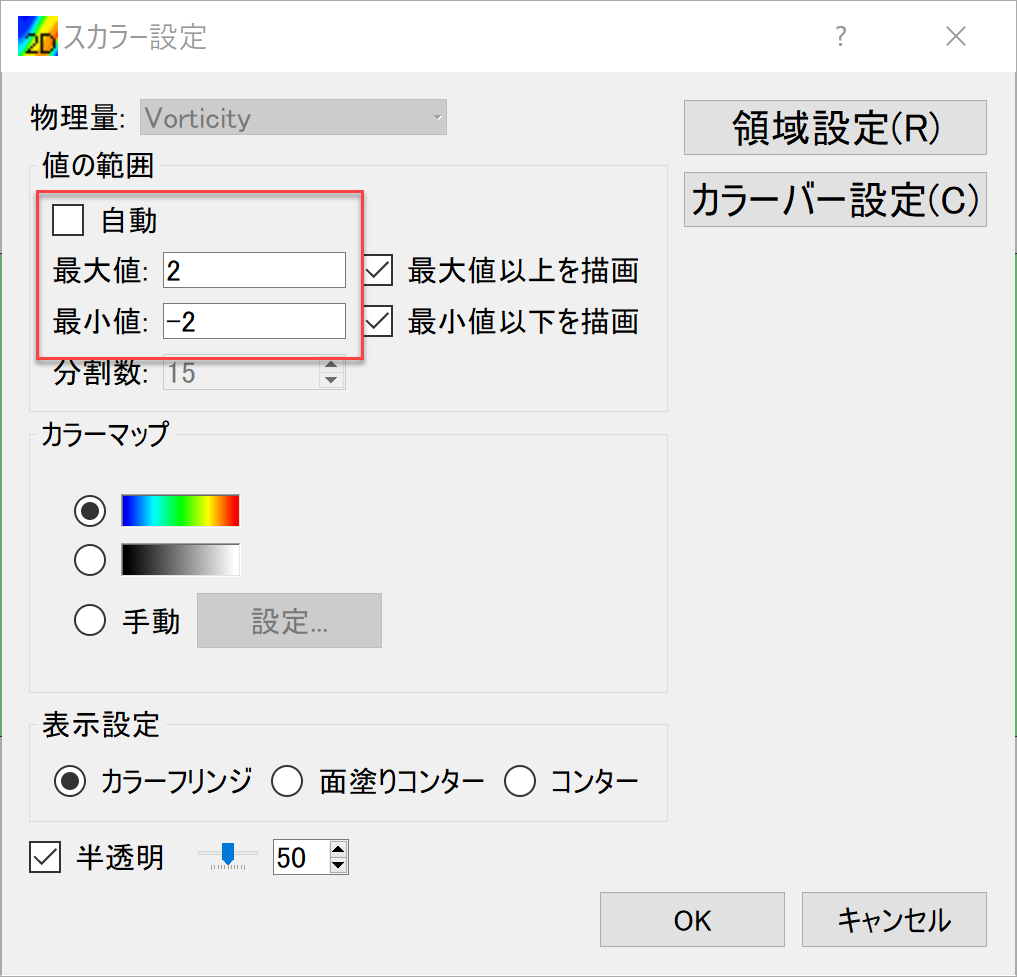
Figure 23 :計算結果の表示(5)
同じ[スカラー設定]ウィンドウで,[カラーマップ]の[手動]ボタンを押して[設定]をクリックして 現れる[カスタムカラー]ウィンドウで[種類]を[3色]にして,[最大値を]赤に,最小値を[青] にして[OK]を押す.
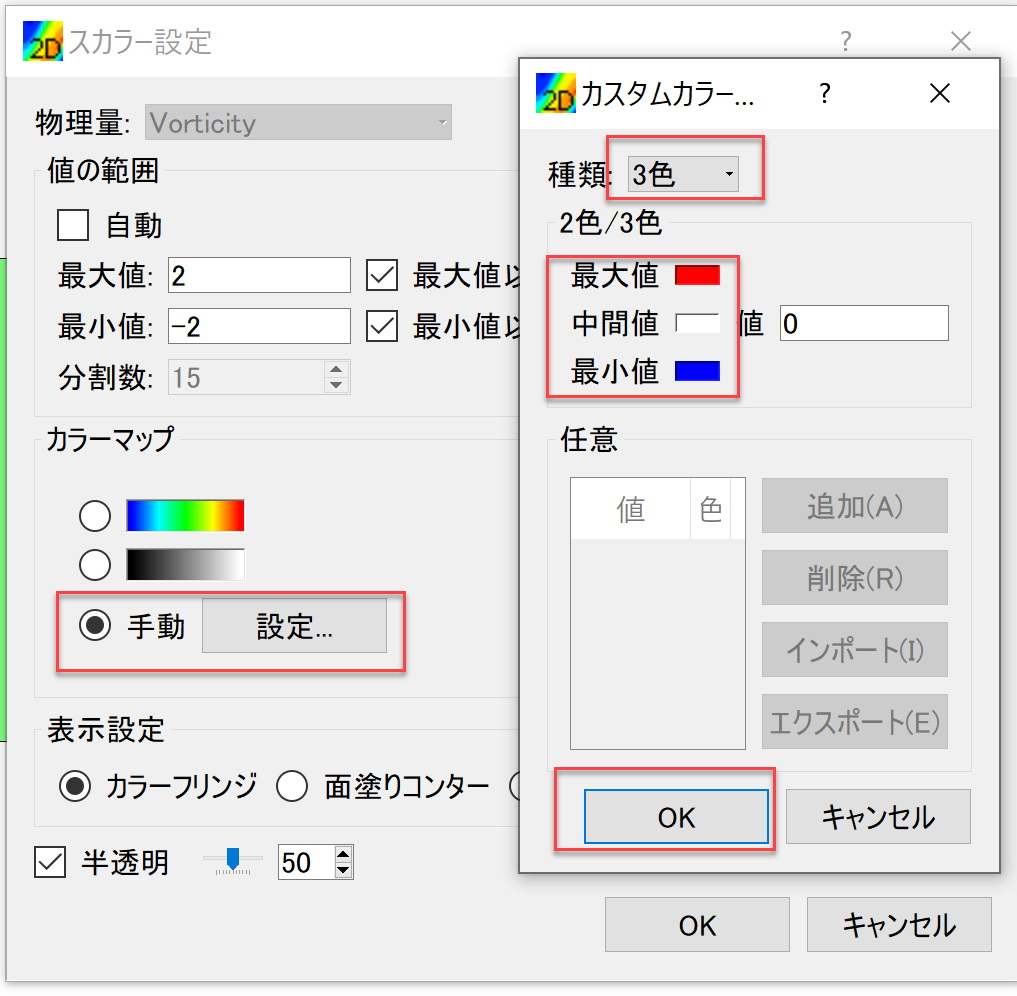
Figure 24 :計算結果の表示(6)
[スカラー設定]ウィンドウに戻って,[半透明]の前の☑ボックスからチェックをはずして,[OK]を押す.
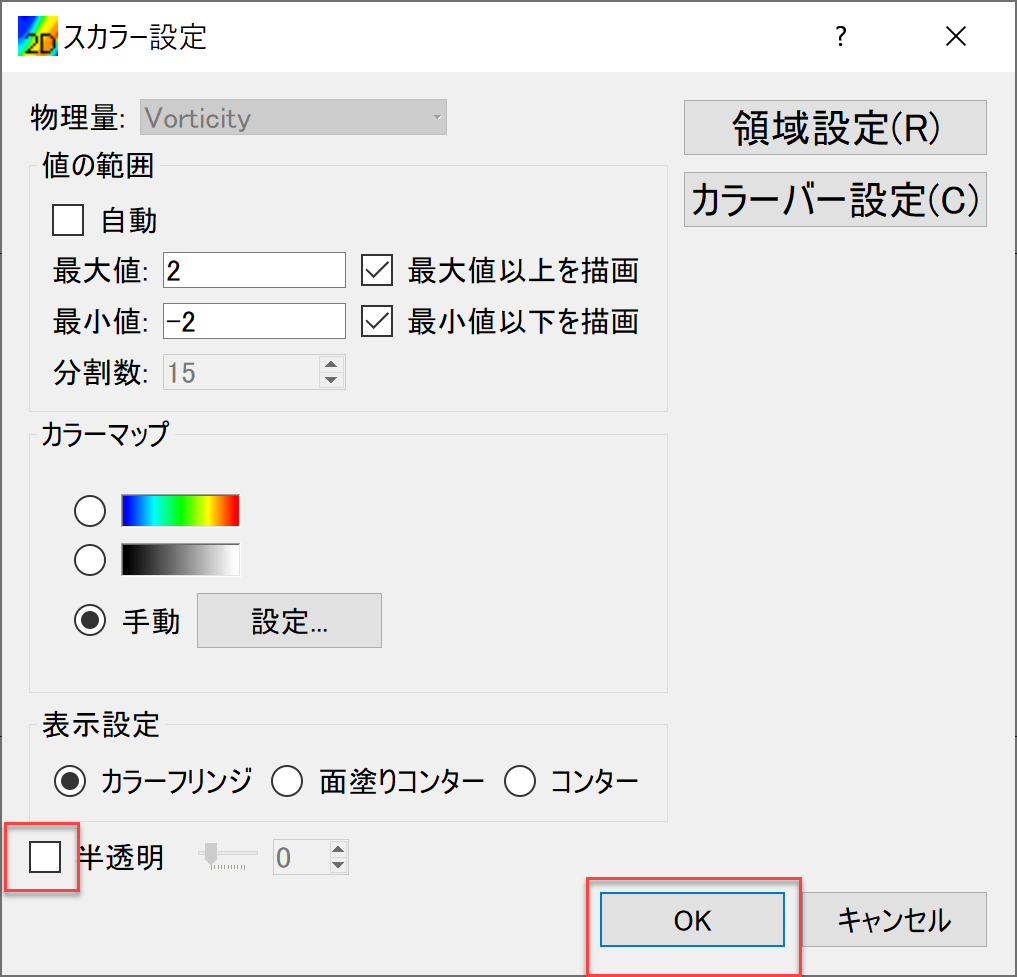
Figure 25 :計算結果の表示(7)
オブジェクトブラウザーの[スカラー]の[Vorticity]をクリックし, カラーマップをドラッグして適当な位置に移動する.さらに,オブジェクトブラウザーで, [時刻]を右クリックして[プロパティ]を表示し.[フォント]のサイズを適当に大きくする.
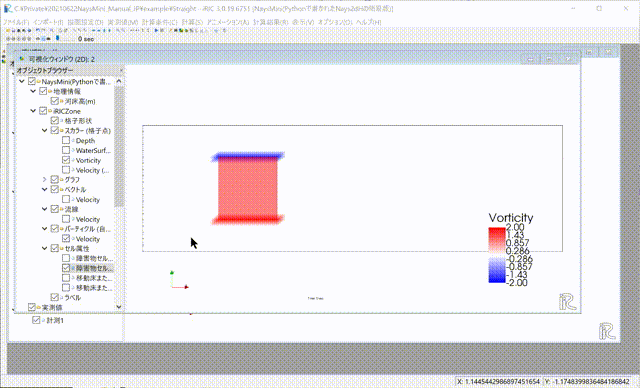
Figure 26 :計算結果の表示(9)
メインメニューから[アニメーション]→[実行]を選択すると,渦度とパーティクルの動画が始まる.
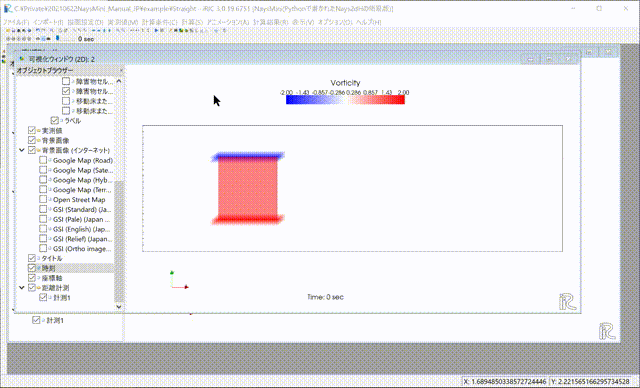
Figure 27 :計算結果の表示(10)
同様に,下記 Figure 28 の手順で,流速ベクトル,流速コンターのアニメーションを 表示できる.
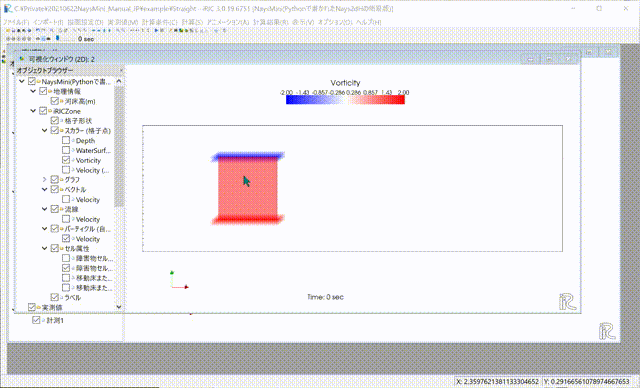
Figure 28 :計算結果の表示(11)
アニメーションファイルの作成
メインメニューから[ファイル]→[連続スナップショット/動画/Google Earth出力]を選択
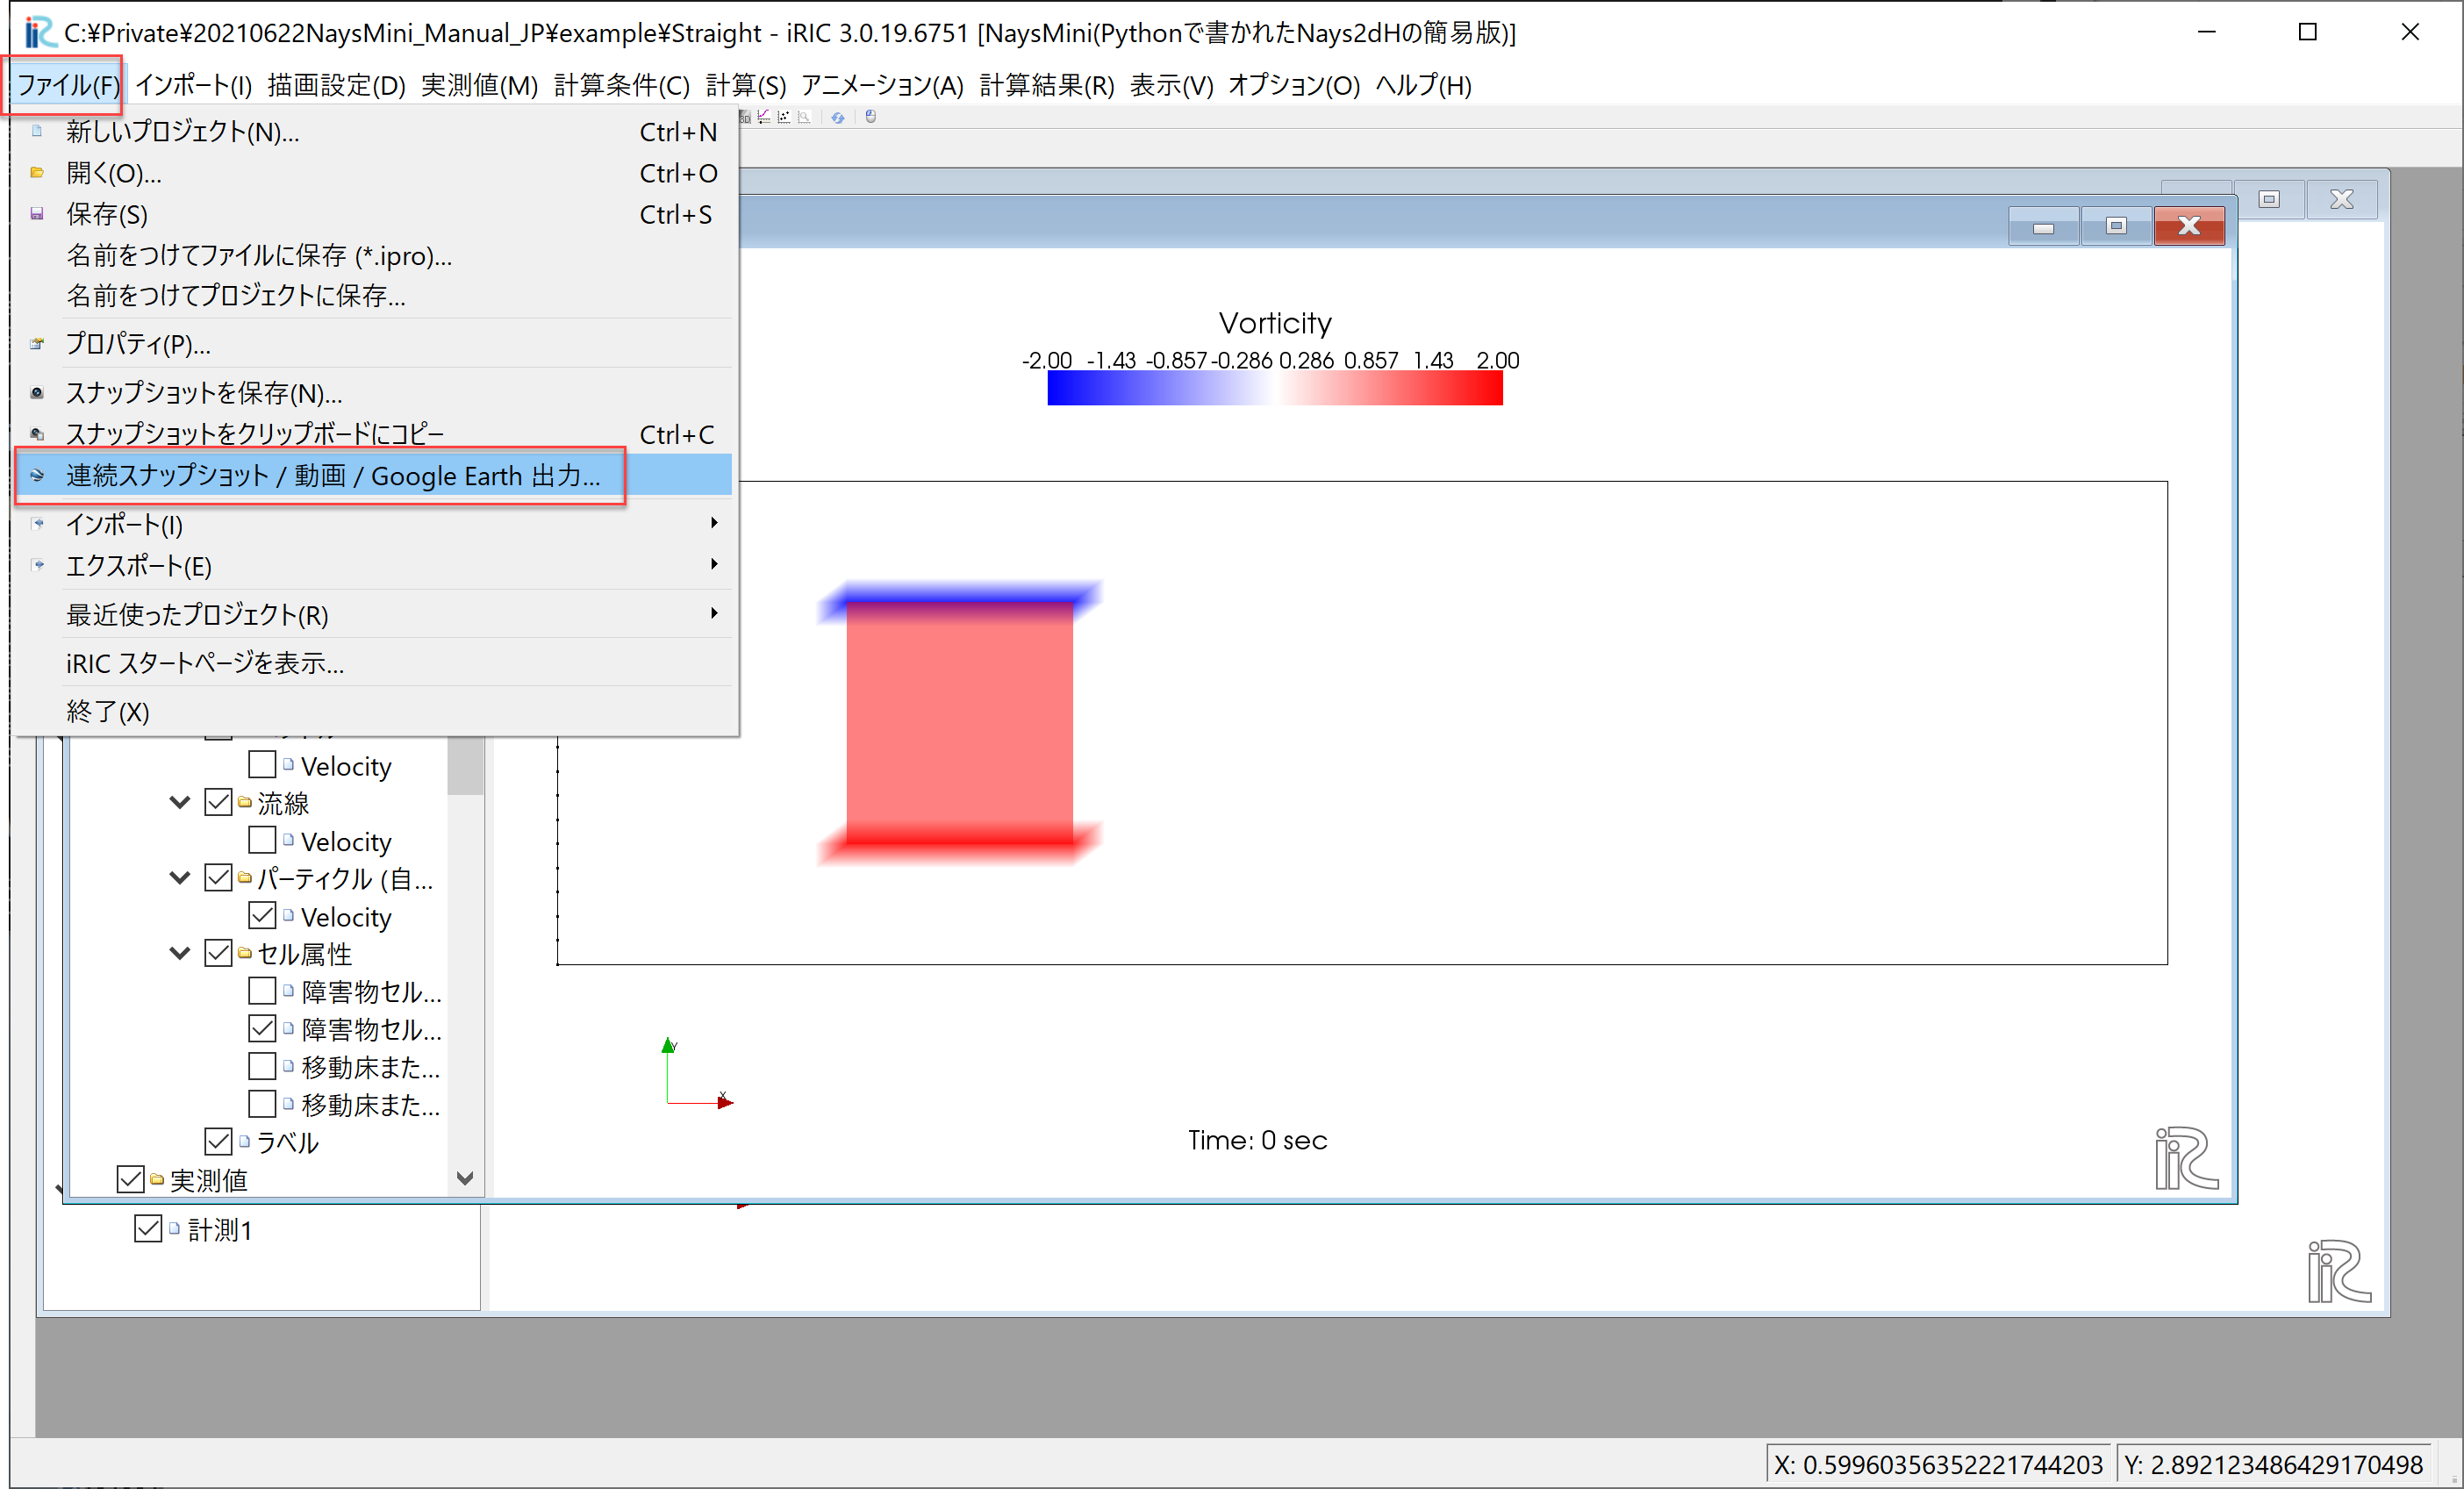
Figure 29 :アニメーションのファイルの作成(1)
[イントロダクション]が表示されるので[次へ]を押す.
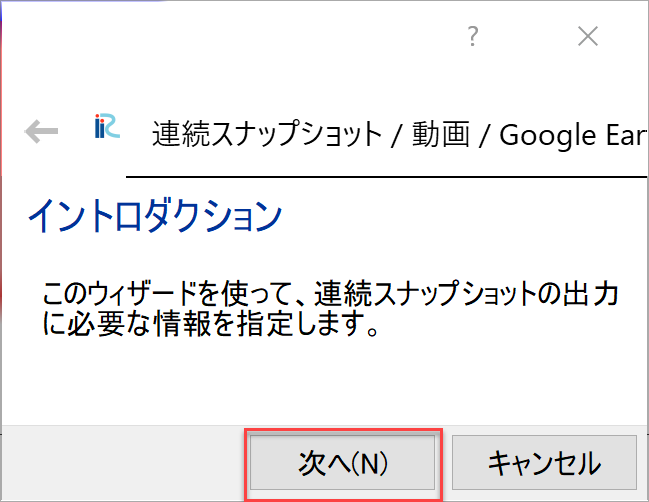
Figure 30 :アニメーションのファイルの作成(2)
[ウィンドウの選択]が表示されるので,アニメーションにしたいウィンドウを選んで[次へ]を押す・
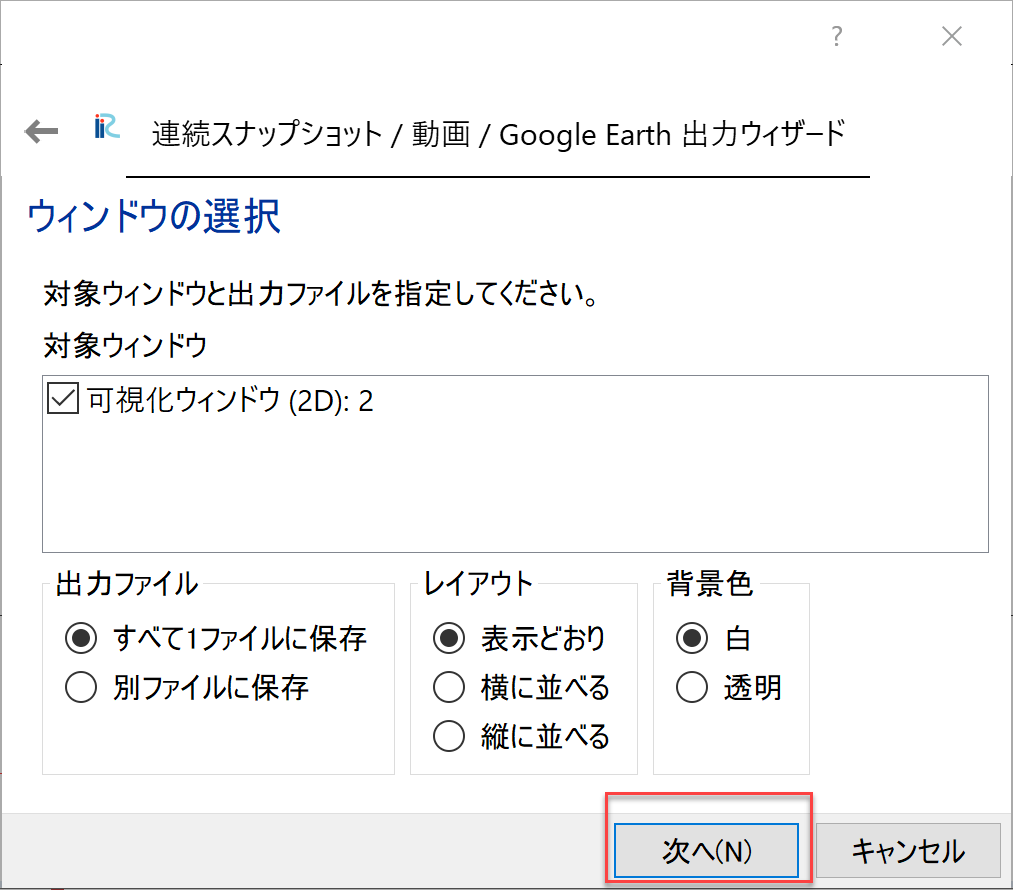
Figure 31 :アニメーションのファイルの作成(3)
[ファイル属性]ウィンドウが表示されるので,ファイルを保存するフォルダ,静止画像の形式,連番の桁数など指定して [次へ]を押す.
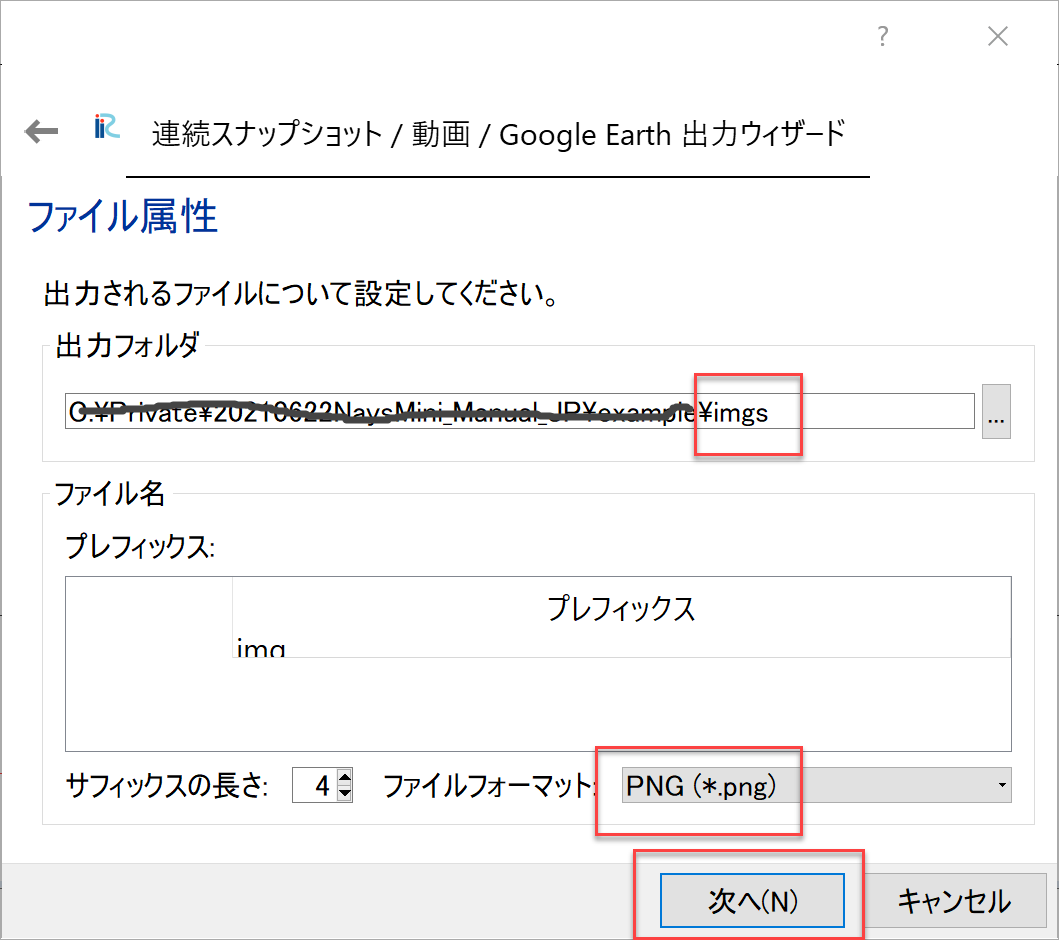
Figure 32 :アニメーションのファイルの作成(4)
[動画ファイルの設定]ウィンドウで,[動画ファイルを出力する]に☑マークを入れる. 動画は[動画の長さ]もしくは[1秒あたりのフレーム数]を指定できるが, ここでは[動画の長さ]を[10秒]に指定し,[次へ]を押す.
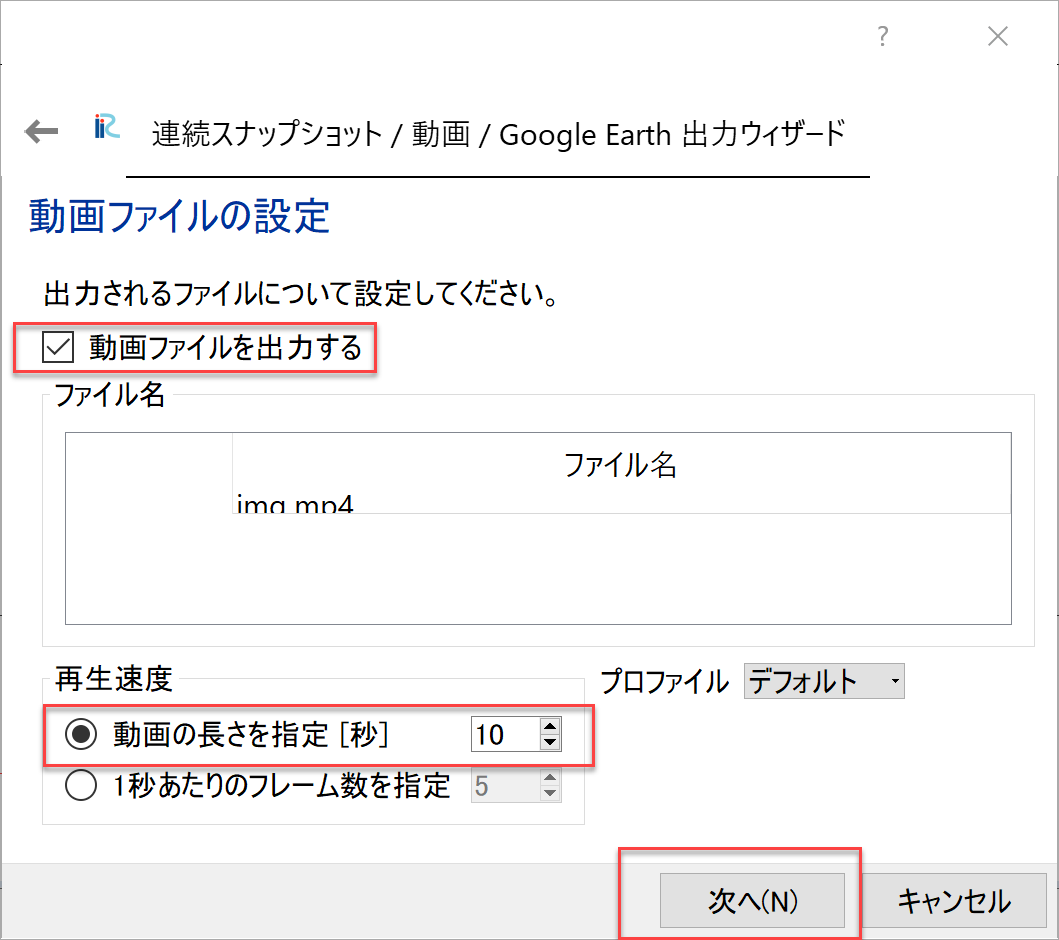
Figure 33 :アニメーションのファイルの作成(5)
[タイムステップ設定]では開始時間,終了時間,間引きなどの指定が出来るので,適宜指定して[次へ]を 押す.
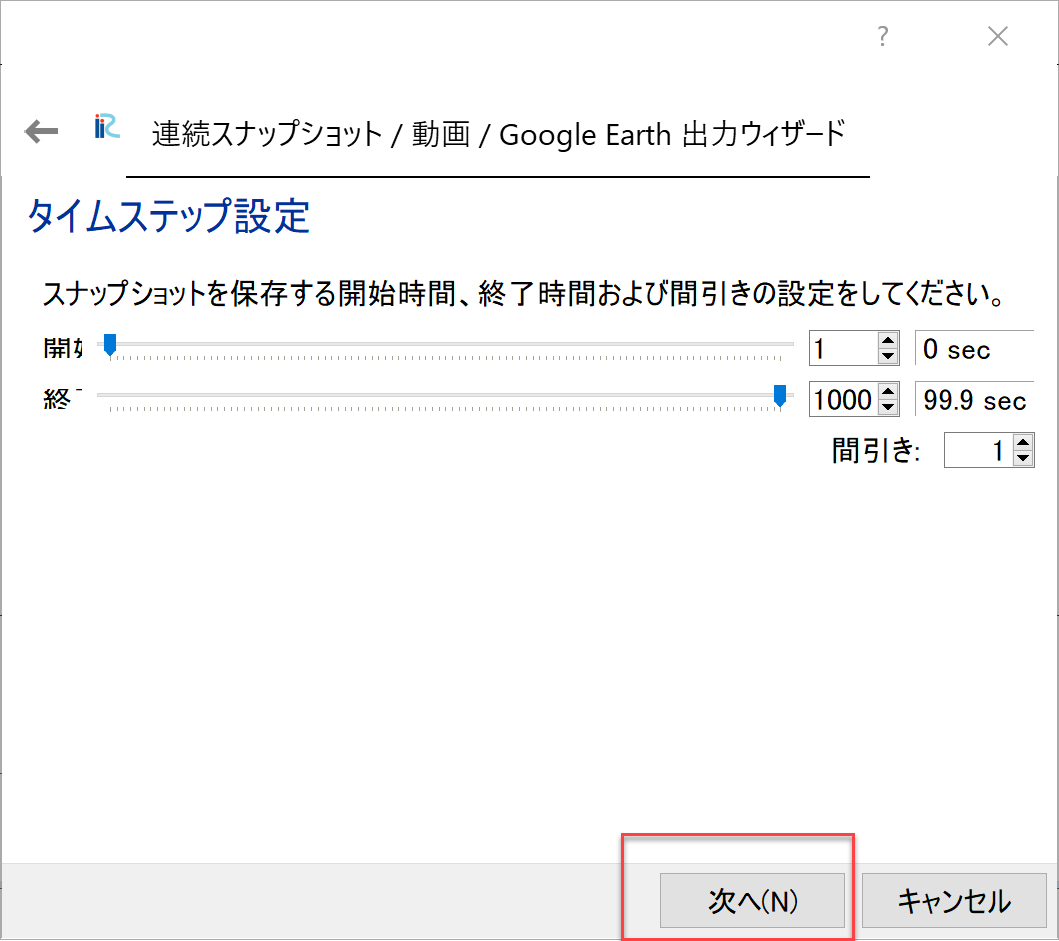
Figure 34 :アニメーションのファイルの作成(6)
iRICでは,アニメーションをGoogle Earthに出力することが出来る.必要であれば [Google Earthに出力する]に☑マークを入れる.不要であれば☐マークは入れないで, [次へ]を押す.
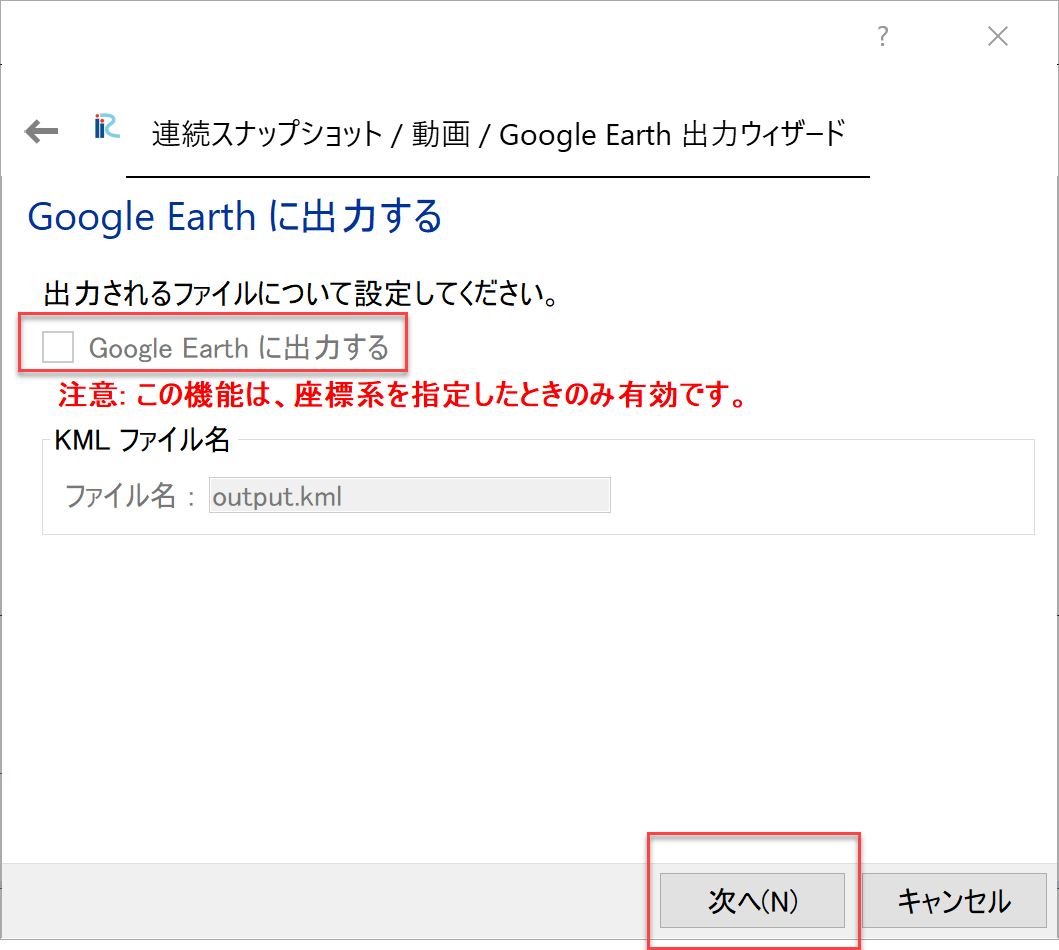
Figure 35 :アニメーションのファイルの作成(7)
最後に生成されるフィルの一覧が表示されるので,確認して良ければ[完了]を押す.
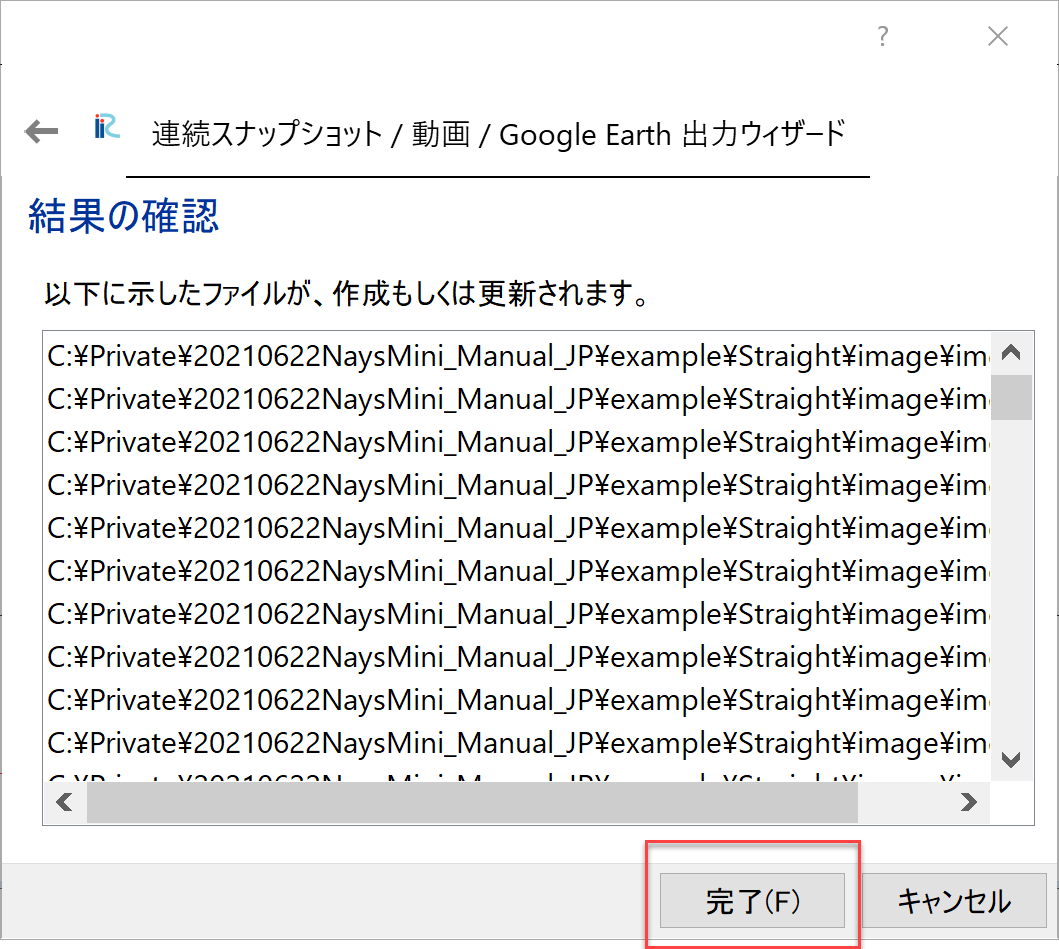
Figure 36 :アニメーションのファイルの作成(8)
保存の進行状況がパーセント表示で示され,終了すると, 指定したフォルダに連番のイメージファイルと動画ファイル(mp4)形式が生成される.
Figure 37 :アニメーションのファイルの作成(9)
動画をmp4以外の形式に変換したい場合は ffmpeg など が便利である.例えば,mp4からgifアニメに変換する場合はコンソール画面で:
ffmpeg -i img.mp4 -vf scale=640:-1 -r 30 -loop 0 img.gif
打ち込めば下記のアニメーションgifが生成される.
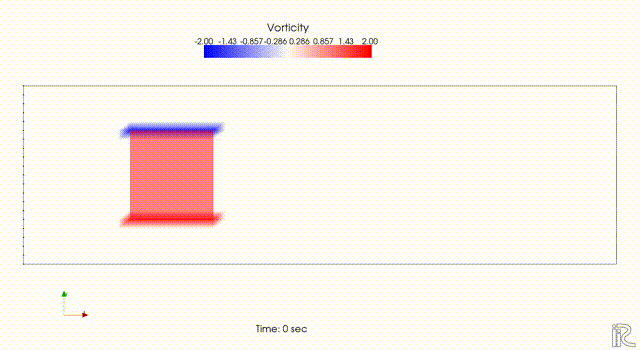
Figure 38 :アニメーションファイル