本テキストへの感想, 質問, 要望, バグ報告などはこちらへお願いします.
2. iRIC用の計算格子を作成する
2.1. 簡単な直交格子の作成例(Example 1)
縦方向と横方向の長さとセルの数を指定して2次元の直交格子を作成します. 水路で言うと,一定幅の直線水路で河川の長さと川幅および,流下方向および横断方向のセル数 をして2次元直交格子を作成することに相当します.
流下方向に \(x\) 軸を, 横断方向に \(y\) 軸を取り, \(x\) 方向の長さを xlength, \(y\) 方向の長さを ylength, \(x\) 方向のセル数を nx, \(y\) 方向のセル数を ny とします.
2.1.1. 格子作成情報定義ファイル
まず,これらのパラメーターをiRIC-V4インストール先の下の "private\gridcreators" フォルダの下に自分が開発する格子生成プログラム専用のフォルダを作成します. ここでは "gc_py1" というフォルダを作成することにします. その下に配置しますの格子生成ツールのパラメータ 入力ウィンドウで入力出来るようにするためには, 格子生成ツールの概要と入力パラメータを記述した情報定義ファイル "definition.xml" を作ります. なお,格子生成ツールの作成方法の詳細については こちら を参照下さい. 上記パラメータをiRICのGUIで入力するための"definition.xml"ファイルを下記に示します.
<?xml version="1.0" encoding="UTF-8"?>
<GridGeneratorDefinition
xmlns="www.iric.net/GridGeneratorDefinition/1.0"
name="sample_gridgenerator_python_1"
caption="Grid Genarator for Python #1" version="0.1"
copyright="iRIC organization"
executable="gc_py1.py"
gridtype="structured2d"
release="2022.5.23"
>
    <GridGeneratingCondition>
    <Tab name="scale" caption="Domain Scale">
    <Item name="xlength" caption="xLength(m)">
        <Definition valueType="real" default="10" max="10000" min="0" />
    </Item>
    <Item name="ylength" caption="yLength(m)">
        <Definition valueType="real" default="10" max="10000" min="0" />
    </Item>
    <Item name="nx" caption="Numbers of cells in X-direction">
        <Definition valueType="integer" default="10" max="10000" min="1" />
    </Item>
    <Item name="ny" caption="Numbers of cells in Y-direction">
        <Definition valueType="integer" default="10" max="10000" min="1" />
    </Item>
    </Tab>
    </GridGeneratingCondition>
</GridGeneratorDefinition>
ここで, caption="Grid Genarator for Python #1" といのが格子生成ツールの名前で, 後述の Figure 2.2 で選択するツール名となります. また, <GridGeneratingCondition> 以下が 格子作成のためのパラメーターの入力要求としてGUI画面に表示される情報で, xlengthおよびylengthがx,y方向の計算領域の長さ, nx, nyがそれぞれ \(x, y\) 方向のセルの数です.
このdefinition.xmlファイルをiRIC Version 4のインストールフォルダの下の "privare/gridcreators"フォルダの下に適当な名前のフォルダを作って(ここでは"gc_py1"とします) その中にコピーすることにより, Figure 2.1 , Figure 2.2 , Figure 2.3 の順でiRICの格子作成用パラメータ入力用のGUI Window 表示することが可能となります.
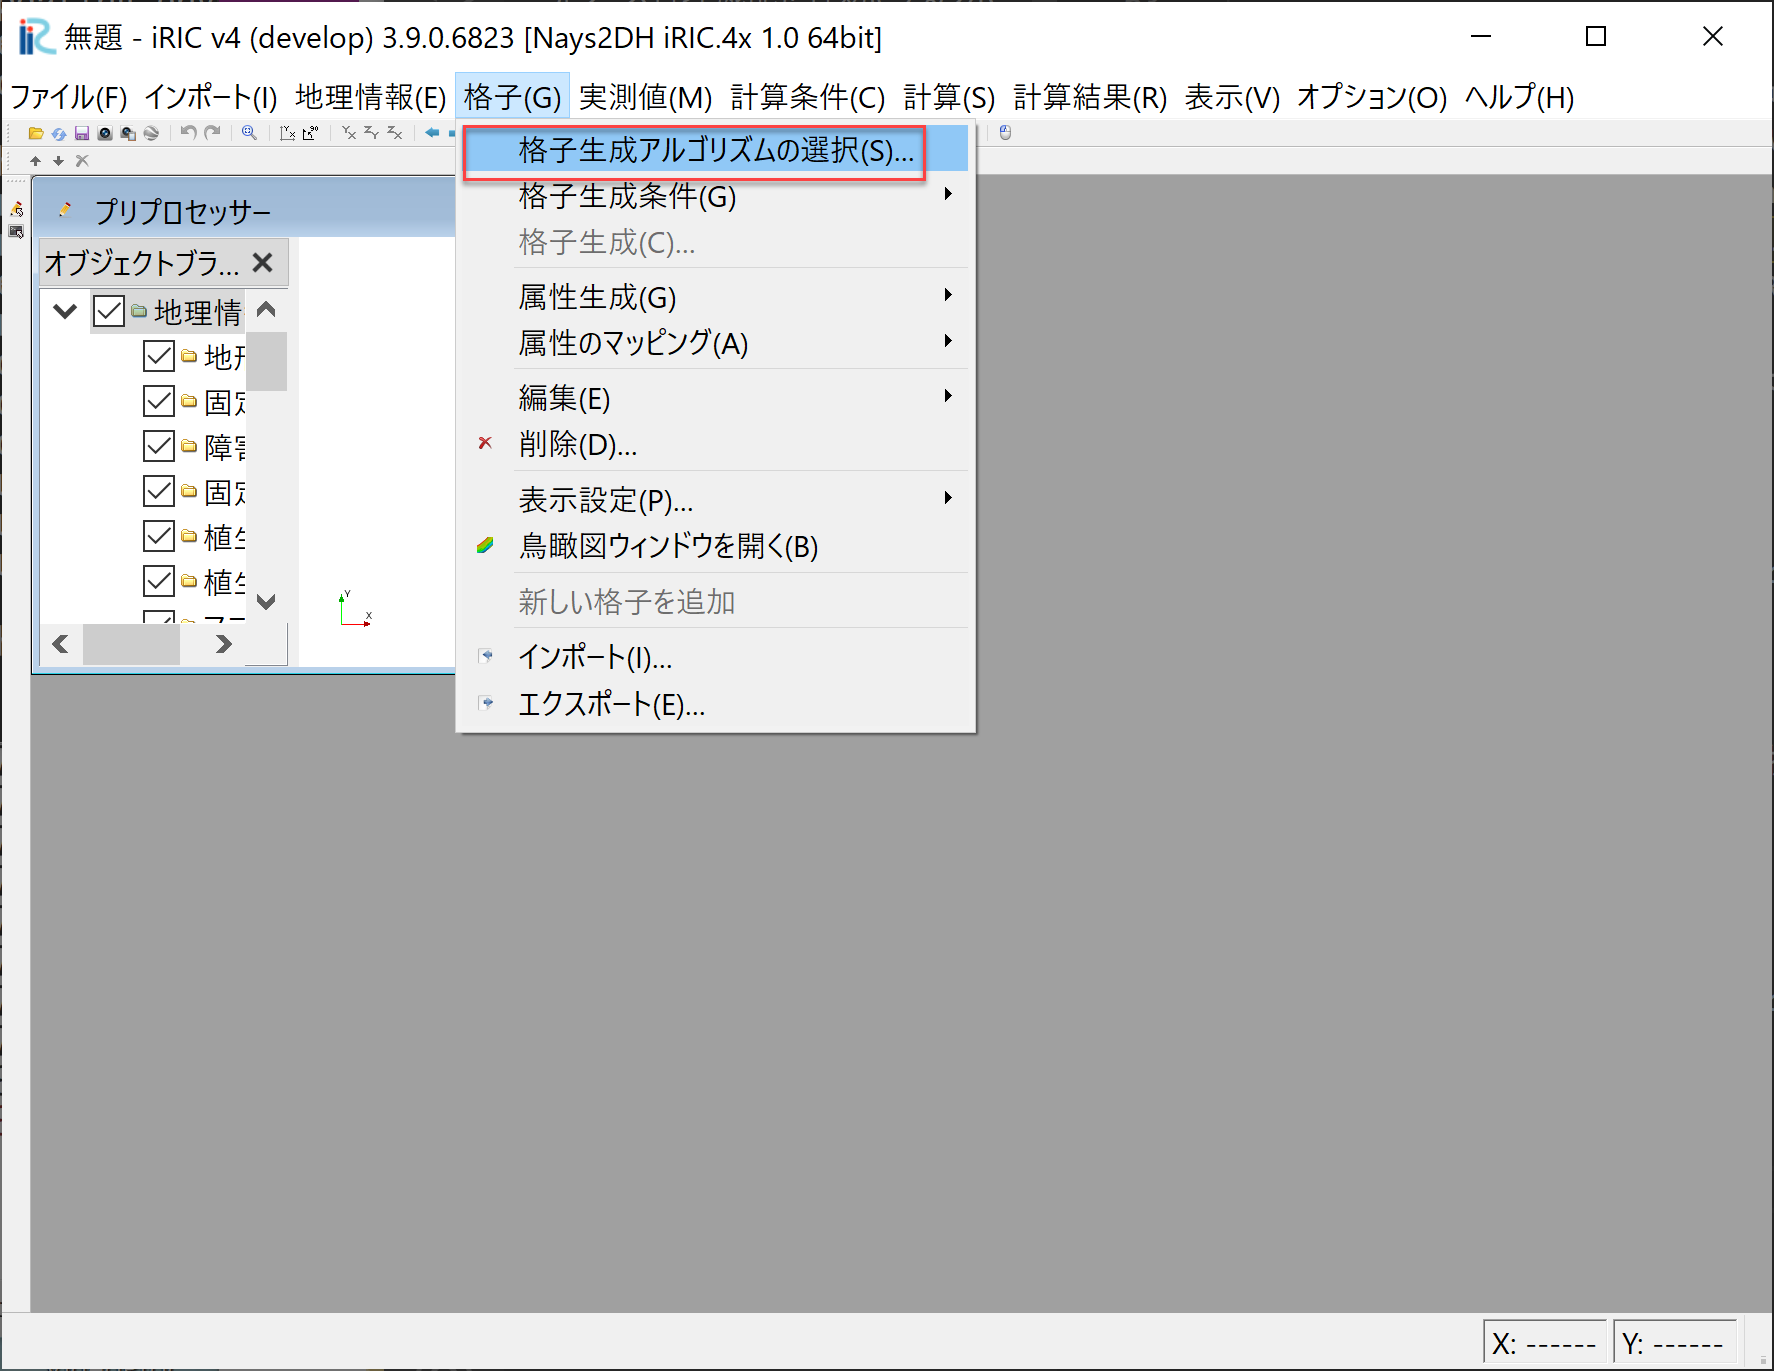
Figure 2.1 : 格子生成アルゴリズムの選択(1)
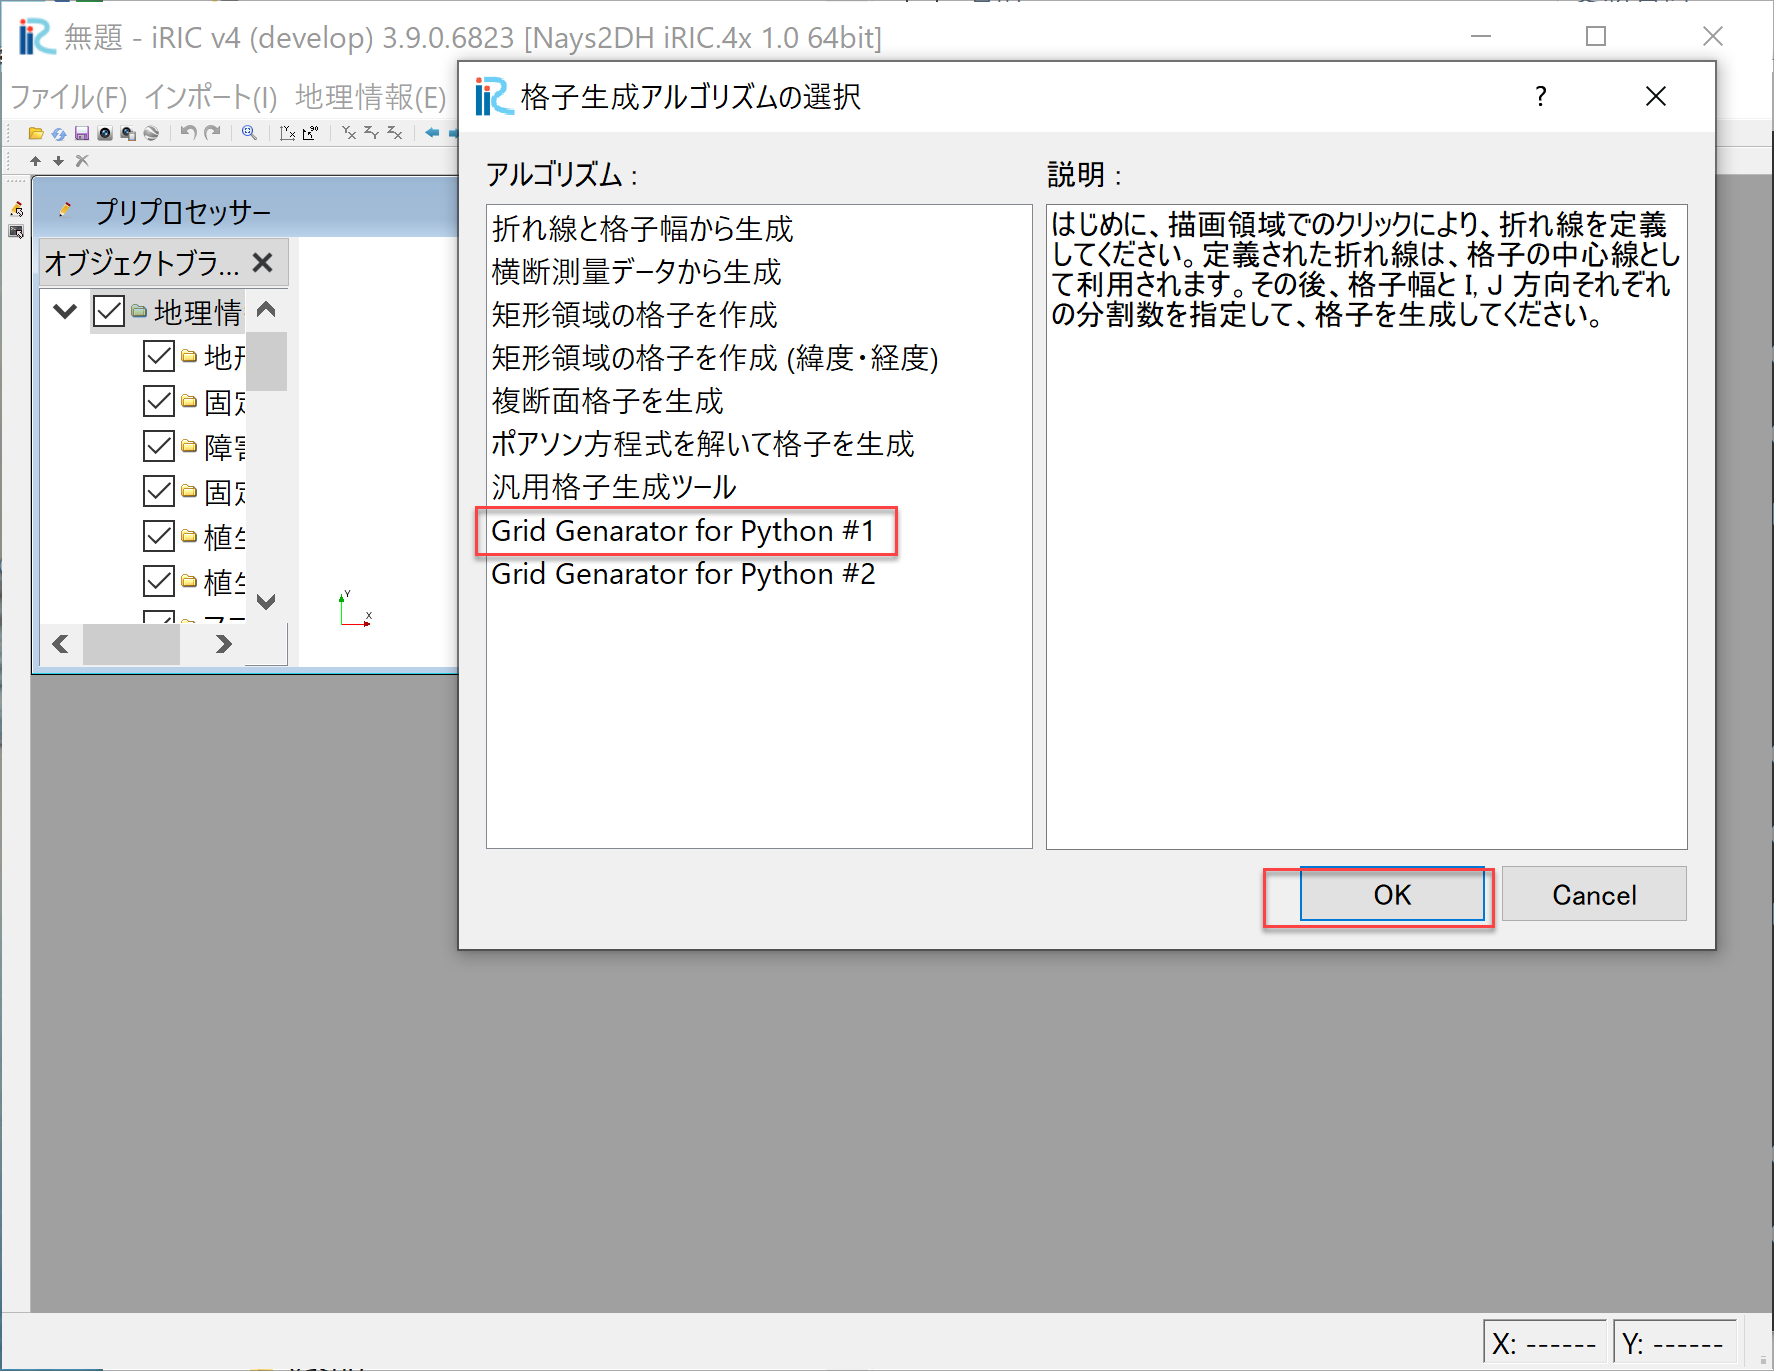
Figure 2.2 : 格子生成アルゴリズムの選択(2)
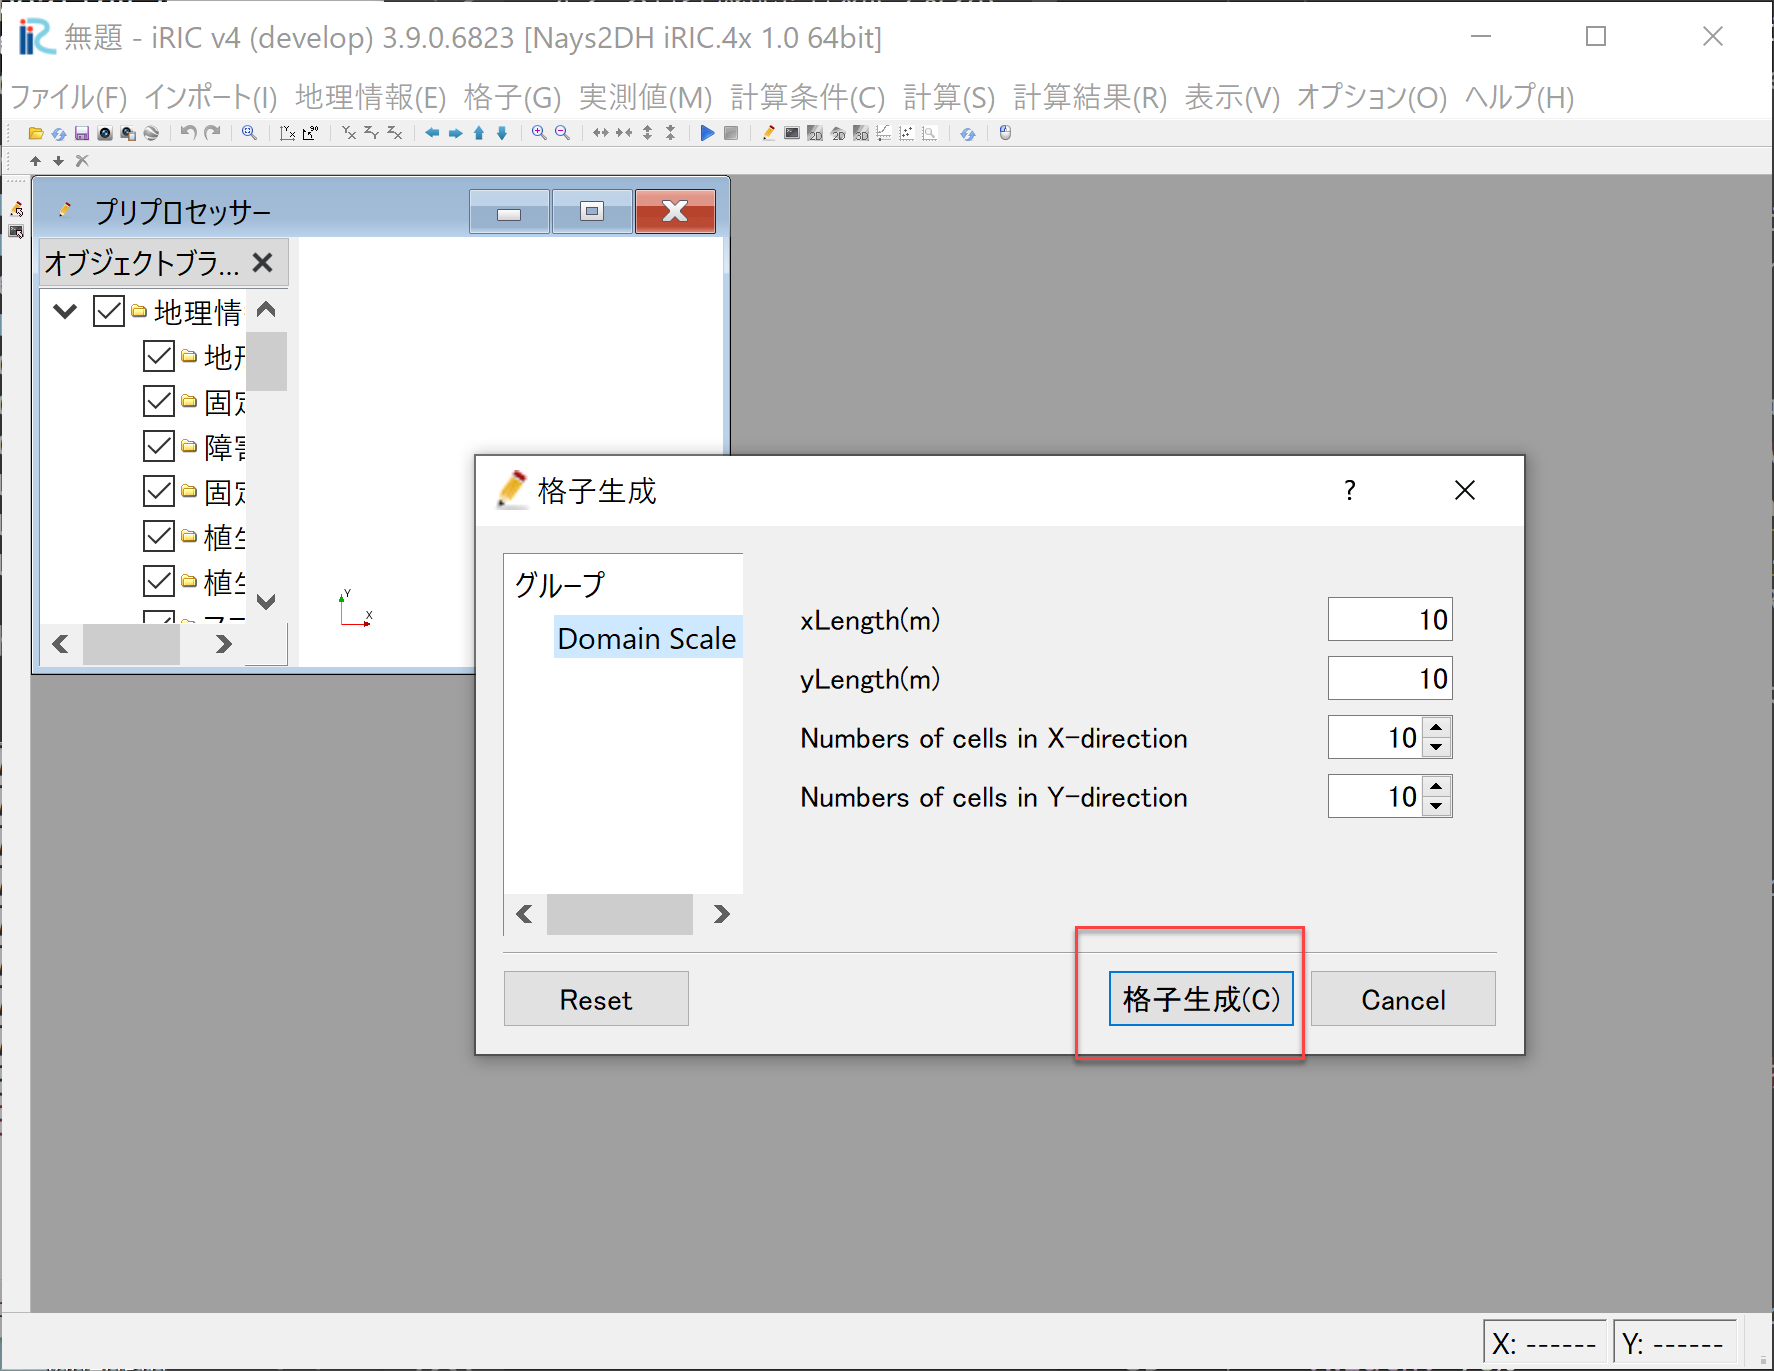
Figure 2.3 : 格子作成用パラメーター入力Window
2.1.2. 格子生成用Pythonコード
Figure 2.3 のGUI Windowで入力されたパラーメータを読み込んで, iRICで用いられるCGNフォーマットの計算格子を作成するためのPhthonコード例を 以下に示します.
import sys
import numpy as np

from iric import *

def main(cgnsName: str):

    fid = cg_iRIC_Open(cgnsName, IRIC_MODE_MODIFY)
    xlength=cg_iRIC_Read_Real(fid,"xlength")
    ylength=cg_iRIC_Read_Real(fid,"ylength")
    nx=cg_iRIC_Read_Integer(fid, "nx")
    ny=cg_iRIC_Read_Integer(fid, "ny")
    isize=nx+1;jsize=ny+1
    x = np.zeros((isize, jsize))
    y = np.zeros((isize, jsize))
    dx=xlength/float(nx);dy=ylength/float(ny)
    for i in np.arange(0,isize):
        for j in np.arange(0,jsize):
            x[i,j]=dx*float(i);y[i,j]=dy*float(j)
    x2 = np.reshape(x, (isize * jsize), order='F')
    y2 = np.reshape(y, (isize * jsize), order='F')
    cg_iRIC_Write_Grid2d_Coords(fid, isize, jsize, x2, y2)
    cg_iRIC_Close(fid)

if __name__ == '__main__':
    if len(sys.argv) < 2:
        print("Error: CGNS file name not specified.")
        exit()
    cgnsName = sys.argv[1]
    main(cgnsName)
上記コード中,
xlength=cg_iRIC_Read_Real(fid,"xlength")
ylength=cg_iRIC_Read_Real(fid,"ylength")
nx=cg_iRIC_Read_Integer(fid, "nx")
ny=cg_iRIC_Read_Integer(fid, "ny")
はGUI Windowに入力されたパラメータをiRIC Libraryを通じて取り込んいる部分です. また,
isize=nx+1;jsize=ny+1
としているのはセル数を入力しましたが,ノード数はセル数+1となるたもこの操作を行っています. 以下, x,y のArrayを作成し,Δx, Δy毎に直交格子を作成してます. なお,x2, y2はiRICのCGNSファイルは多次元配列もすべて1次元に置き換えて保存しているため, iRICのCGNファイル用に変換され,最終的には
cg_iRIC_Write_Grid2d_Coords(fid, isize, jsize, x2, y2)
で保存されます.
2.1.3. 格子生成の実行と確認
このコード(ここでは "gc_py1.py" とします)を上記"definition.xml"と同じ フォルダ,すなわち,iRIC Version 4のインストールフォルダの下の "private/gridcreators/gc_py1"にコピーすすることによって実行可能となります.
実行は Figure 2.3 でパラメーターの入力完了後に[格子生成]ボタンを押すことにより, Figure 2.4 のような確認ボタンが現れますので[Yes]を押すことにより, 格子生成が行われ,Figure 2.5 に示す計算格子が作成されます.

Figure 2.4 : 確認Window
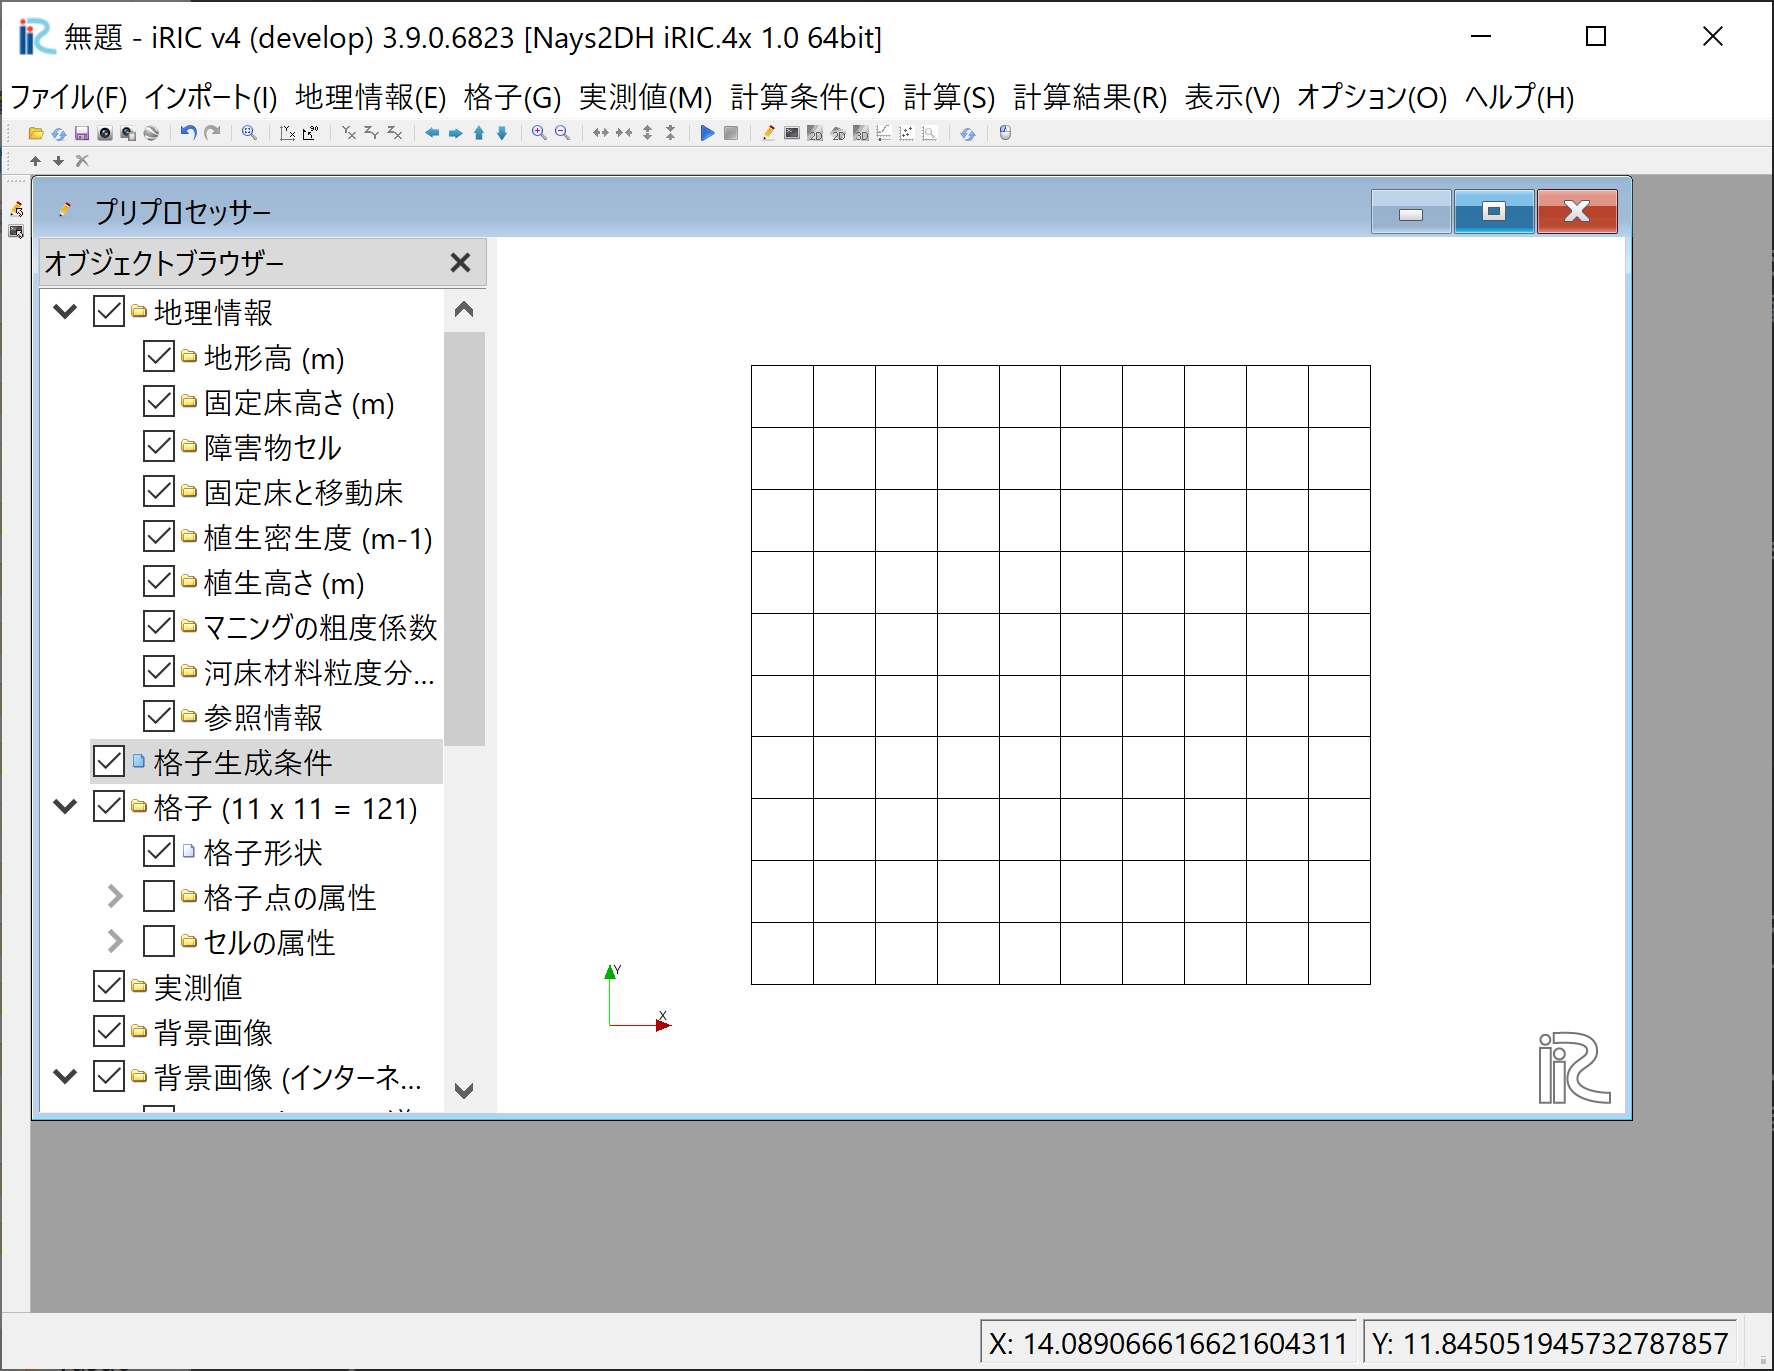
Figure 2.5 : 格子の作成結果
2.2. 交互砂州形状の河床を有する直線水路(Example 2)
ここでは,直線水路に左右交互に起伏を有する水路の格子形成を行います. 河床形状はこの式で https://i-ric.org/yasu/nbook2/08_Chapt08.html#art-bar
\(s\) を \(x\) に, \(n\) を \(y\) に変更したもを使用し, \(\delta_s\) は変面形状と砂州形状の位相差ですが, この例では直線河道ですので, 単純に上流端( \(x=0\))における砂州計上の位相です. これを考慮して上式を再記すると,
ただし, \(\Delta_z\) 基準高さからの比高,\(A_p\) は砂州波高, \(L\) は砂州波長, \(B\) は水路幅, \(x\) は上流端から下流に向かった距離, \(y\) は右岸から 左岸に向かった距離, \(\delta s\) 上流端での位相です.
水路長さは (2.1) 式中の波長 \(L\) に波数 \(m\) を乗じた 長さで定義されるとすれば,流下方向および横断方向の計算領域の長さ[ 前の例( 簡単な直交格子の作成例(Example 1) )のxlength, ylengthに相当]は次式となります.
ただし \(x_l\) , \(y_l\) は流下方向, 横断方向の計算領域の長さです. 水路全体の河床高を指定する場合,水路勾配と,水路の何処かの地点での河床高を 与える必要があり, ここでは水路勾配を \(i_b\) , 基準点は下流端で与えるものとして 下流端河床高を \(z_{b0}\) とします. 従って, ここで生成する水路は下流端で \(z_{b0}\) で 勾配が \(i_b\) の一定勾配 水路の上に (2.1) 式で示される砂州計上が乗った河床形状の直線水路という ことになります.すなわち,
ただし, \(z_b\) は河床高, \(\Delta_z\) は (2.1) 式で表される 2次元砂州形状です.
2.2.1. 格子作成情報定義ファイル
iRIC-V4インストール先の下の "private\gridcreators" に "gc_py2" というフォルダを作成し, その中に下記の格子作成情報定義ファイル"default.xml" ファイル を置きます.
<?xml version="1.0" encoding="UTF-8"?>
<GridGeneratorDefinition
xmlns="www.iric.net/GridGeneratorDefinition/1.0"
name="sample_grid_generator_python_2"
caption="Grid Genarator for Python #2" version="0.1"
copyright="iRIC organization"
executable="gc_py2.py"
gridtype="structured2d"
release="2022.6.7"
>
    <GridGeneratingCondition>
    <Tab name="scale" caption="Domain Scale">
    <Item name="L" caption="wave length(m)">
        <Definition valueType="real" default="2" max="10000" min="0" />
    </Item>
    <Item name="m" caption="wave number">
        <Definition valueType="integer" default="3" max="10000" min="1" />
    </Item>
    <Item name="delta_s" caption="phase difference(m)">
        <Definition valueType="real" default="0"/>
    </Item>
    <Item name="B" caption="channel width(m)">
        <Definition valueType="real" default="0.2" max="10000" min="0" />
    </Item>
    <Item name="i_b" caption="channel slope">
        <Definition valueType="real" default="0.01"/>
    </Item>
    <Item name="z_b0" caption="downstream bed elevation(m)">
        <Definition valueType="real" default="0"/>
    </Item>
    <Item name="A_p" caption="alternate bar amplitude(m)">
        <Definition valueType="real" default="0.05" />
    </Item>

    </Tab>
    </GridGeneratingCondition>
</GridGeneratorDefinition>
2.2.2. 格子生成用Pythonコード
上記で作成した "gc_py2" というフォルダに下記の格子作成用のPythonコードファイル "gc_py2.py" を置きます.
from ctypes.wintypes import WIN32_FIND_DATAA
from pydoc import apropos
import sys
import numpy as np

from iric import *

def main(cgnsName: str):

    fid = cg_iRIC_Open(cgnsName, IRIC_MODE_MODIFY)
    wl=cg_iRIC_Read_Real(fid,"L")
    wn=cg_iRIC_Read_Integer(fid,"m")
    lag=cg_iRIC_Read_Real(fid,"delta_s")
    width=cg_iRIC_Read_Real(fid,"B")
    slope=cg_iRIC_Read_Real(fid,"i_b")
    elv_d=cg_iRIC_Read_Real(fid,"z_b0")
    ap=cg_iRIC_Read_Real(fid,"A_p")
    nx=cg_iRIC_Read_Integer(fid, "nx")
    ny=cg_iRIC_Read_Integer(fid, "ny")
    isize=nx+1;jsize=ny+1
    x = np.zeros((isize, jsize))
    y = np.zeros((isize, jsize))
    zb = np.zeros((isize, jsize))
    pi=np.pi

    xlength=wl*float(wn)
    ylength=width

    dx=xlength/float(nx);dy=ylength/float(ny)

    for i in np.arange(0,isize):
        for j in np.arange(0,jsize):
            x[i,j]=dx*float(i);y[i,j]=dy*float(j)
            zb[i,j]=elv_d+(xlength-x[i,j])*slope \
                -ap*np.cos(2.*pi/wl*(x[i,j]-lag))  \
                *np.cos(pi/width*y[i,j])
            print(i,j,zb[i,j])

    x2 = np.reshape(x, (isize * jsize), order='F')
    y2 = np.reshape(y, (isize * jsize), order='F')
    z2 = np.reshape(zb, (isize * jsize), order='F')

    cg_iRIC_Write_Grid2d_Coords(fid, isize, jsize, x2, y2)
    cg_iRIC_Write_Grid_Real_Node(fid, "Elevation", z2)
    cg_iRIC_Close(fid)

if __name__ == '__main__':
    if len(sys.argv) < 2:
        print("Error: CGNS file name not specified.")
        exit()
    cgnsName = sys.argv[1]
    main(cgnsName)
2.2.3. 格子生成の実行と確認
iRIC Version 4 を起動後, [新しいプロジェクト]を選択します( Figure 2.6 ).
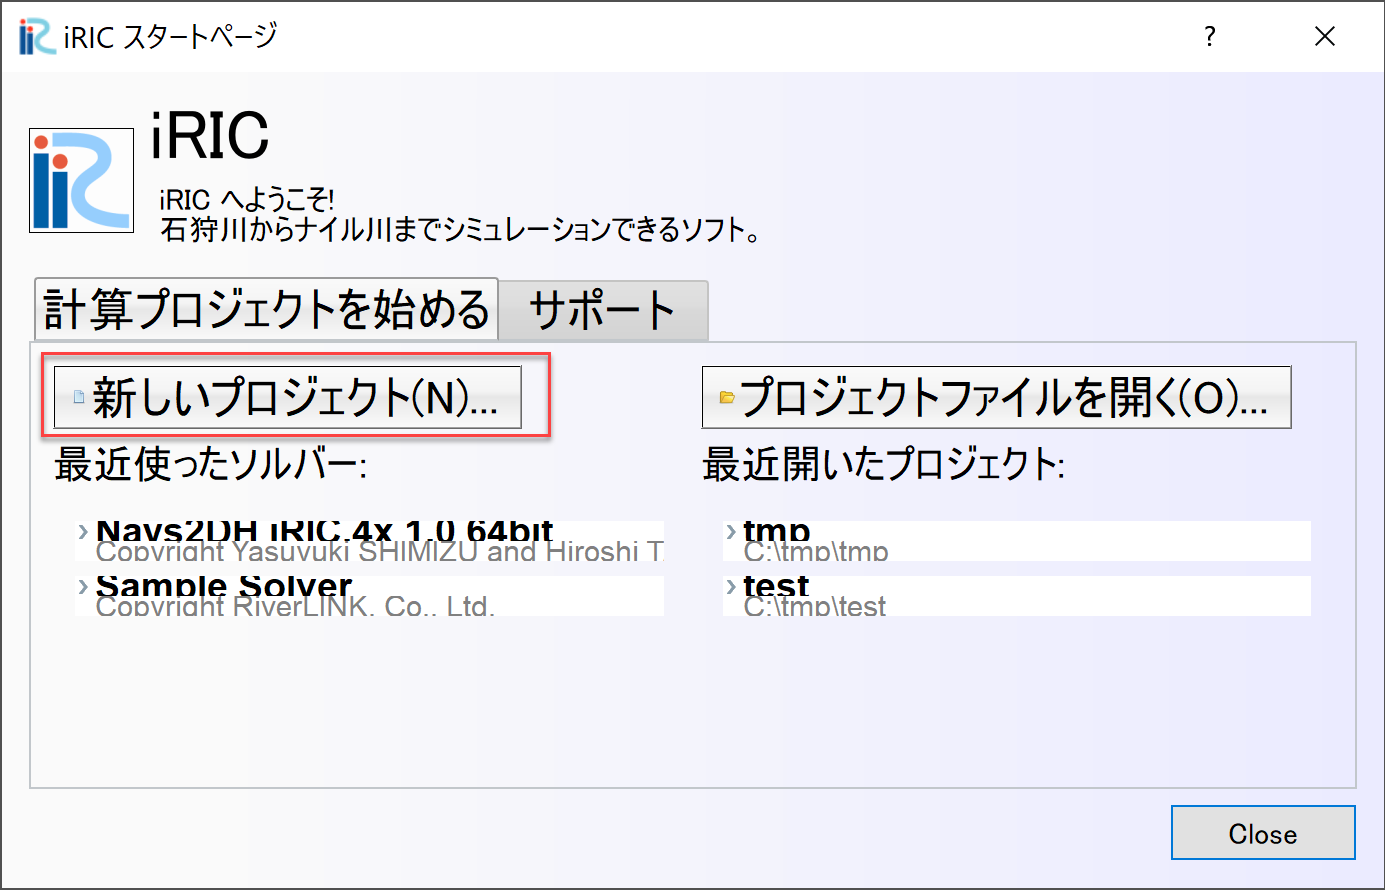
Figure 2.6 : 新しいプロジェクト
ソルバー選択Windowで,(ソルバーは何でも良いのですが)とりあえず何か選ばないと次に進めないので, [Nays2dH]を選択し,[OK]ボタンを押します( Figure 2.7 ).
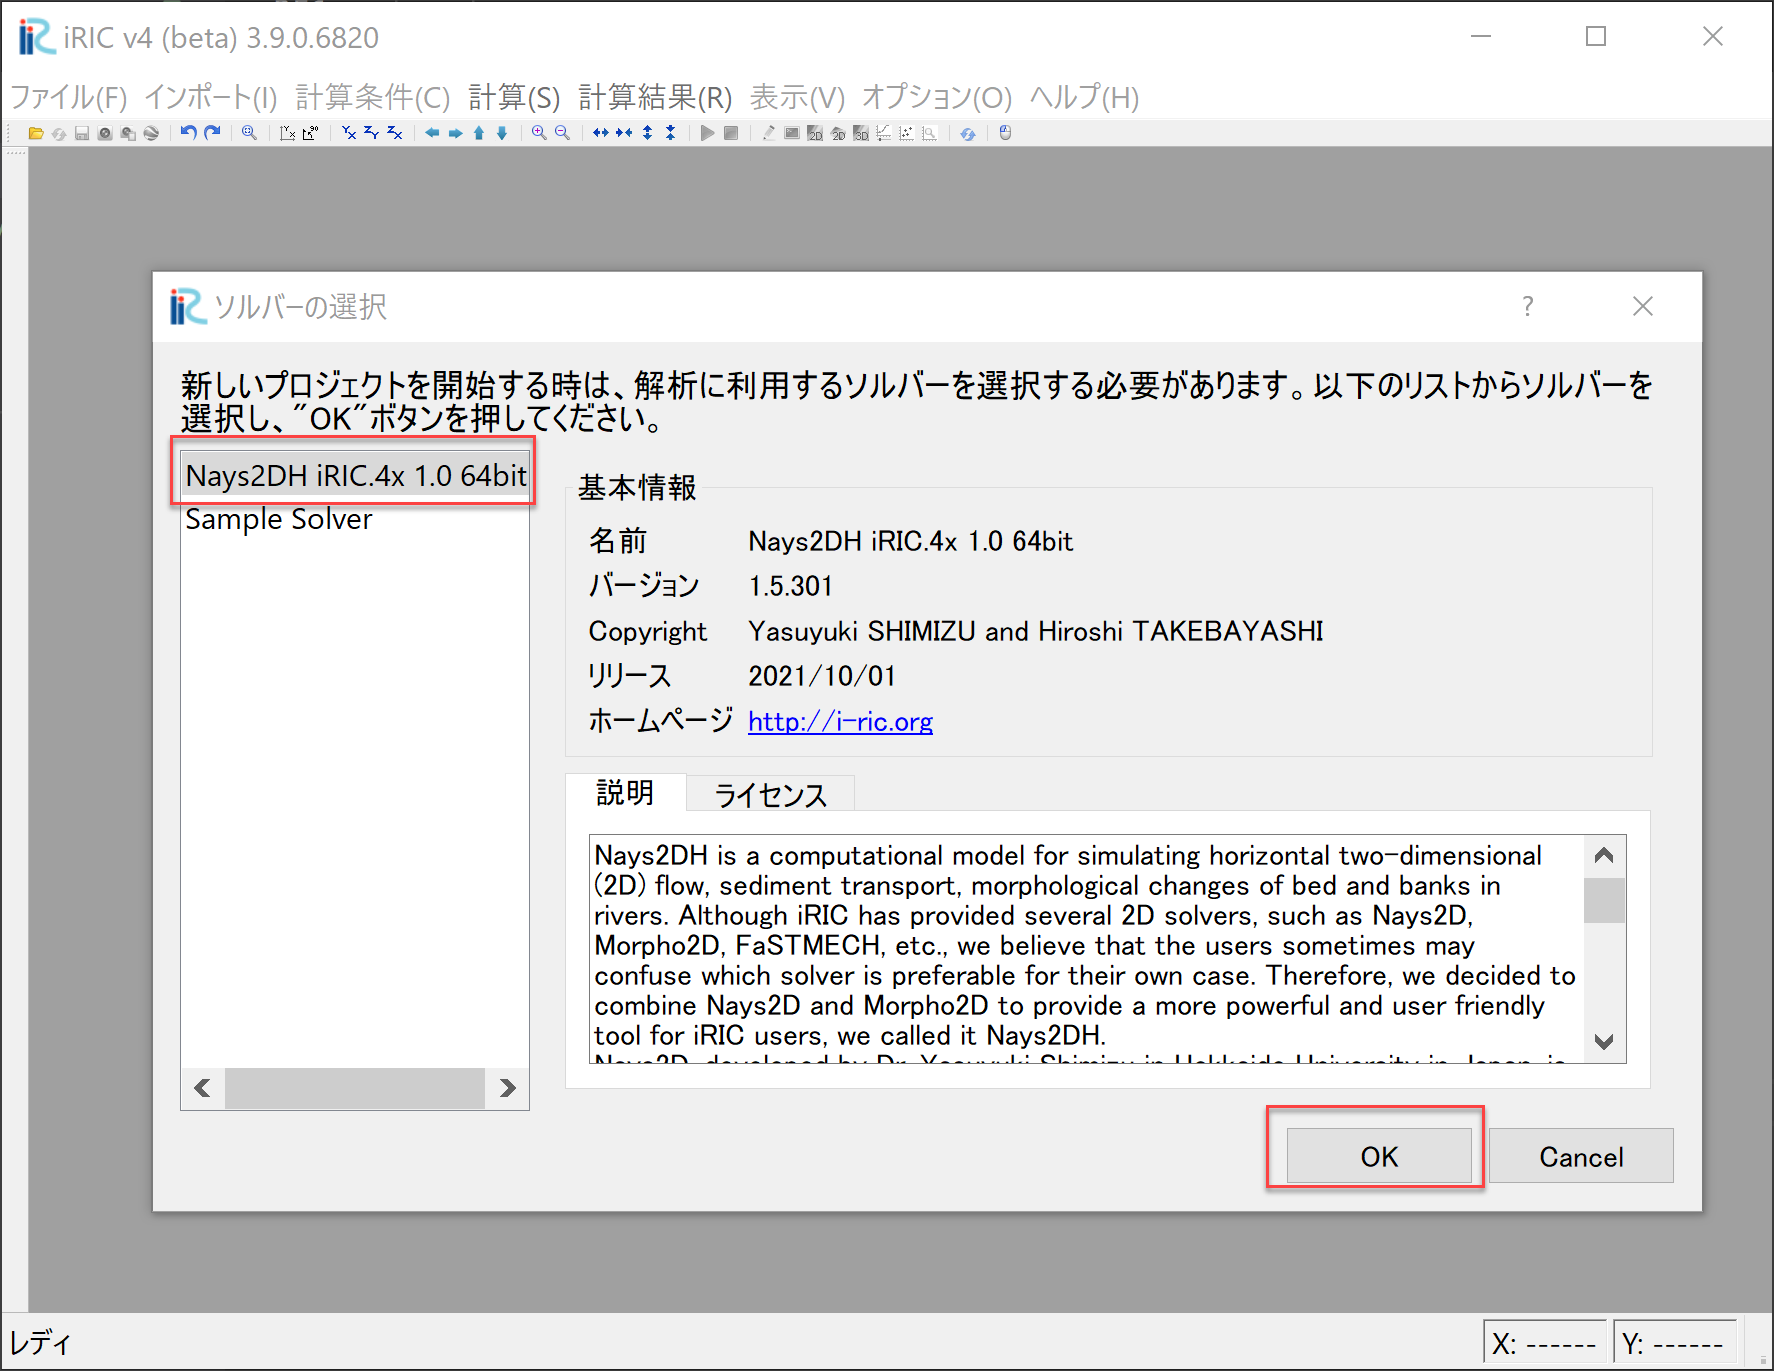
Figure 2.7 : ソルバーの選択
[格子]→[格子生成アルゴリズムの選択]を選びます( Figure 2.8 ).
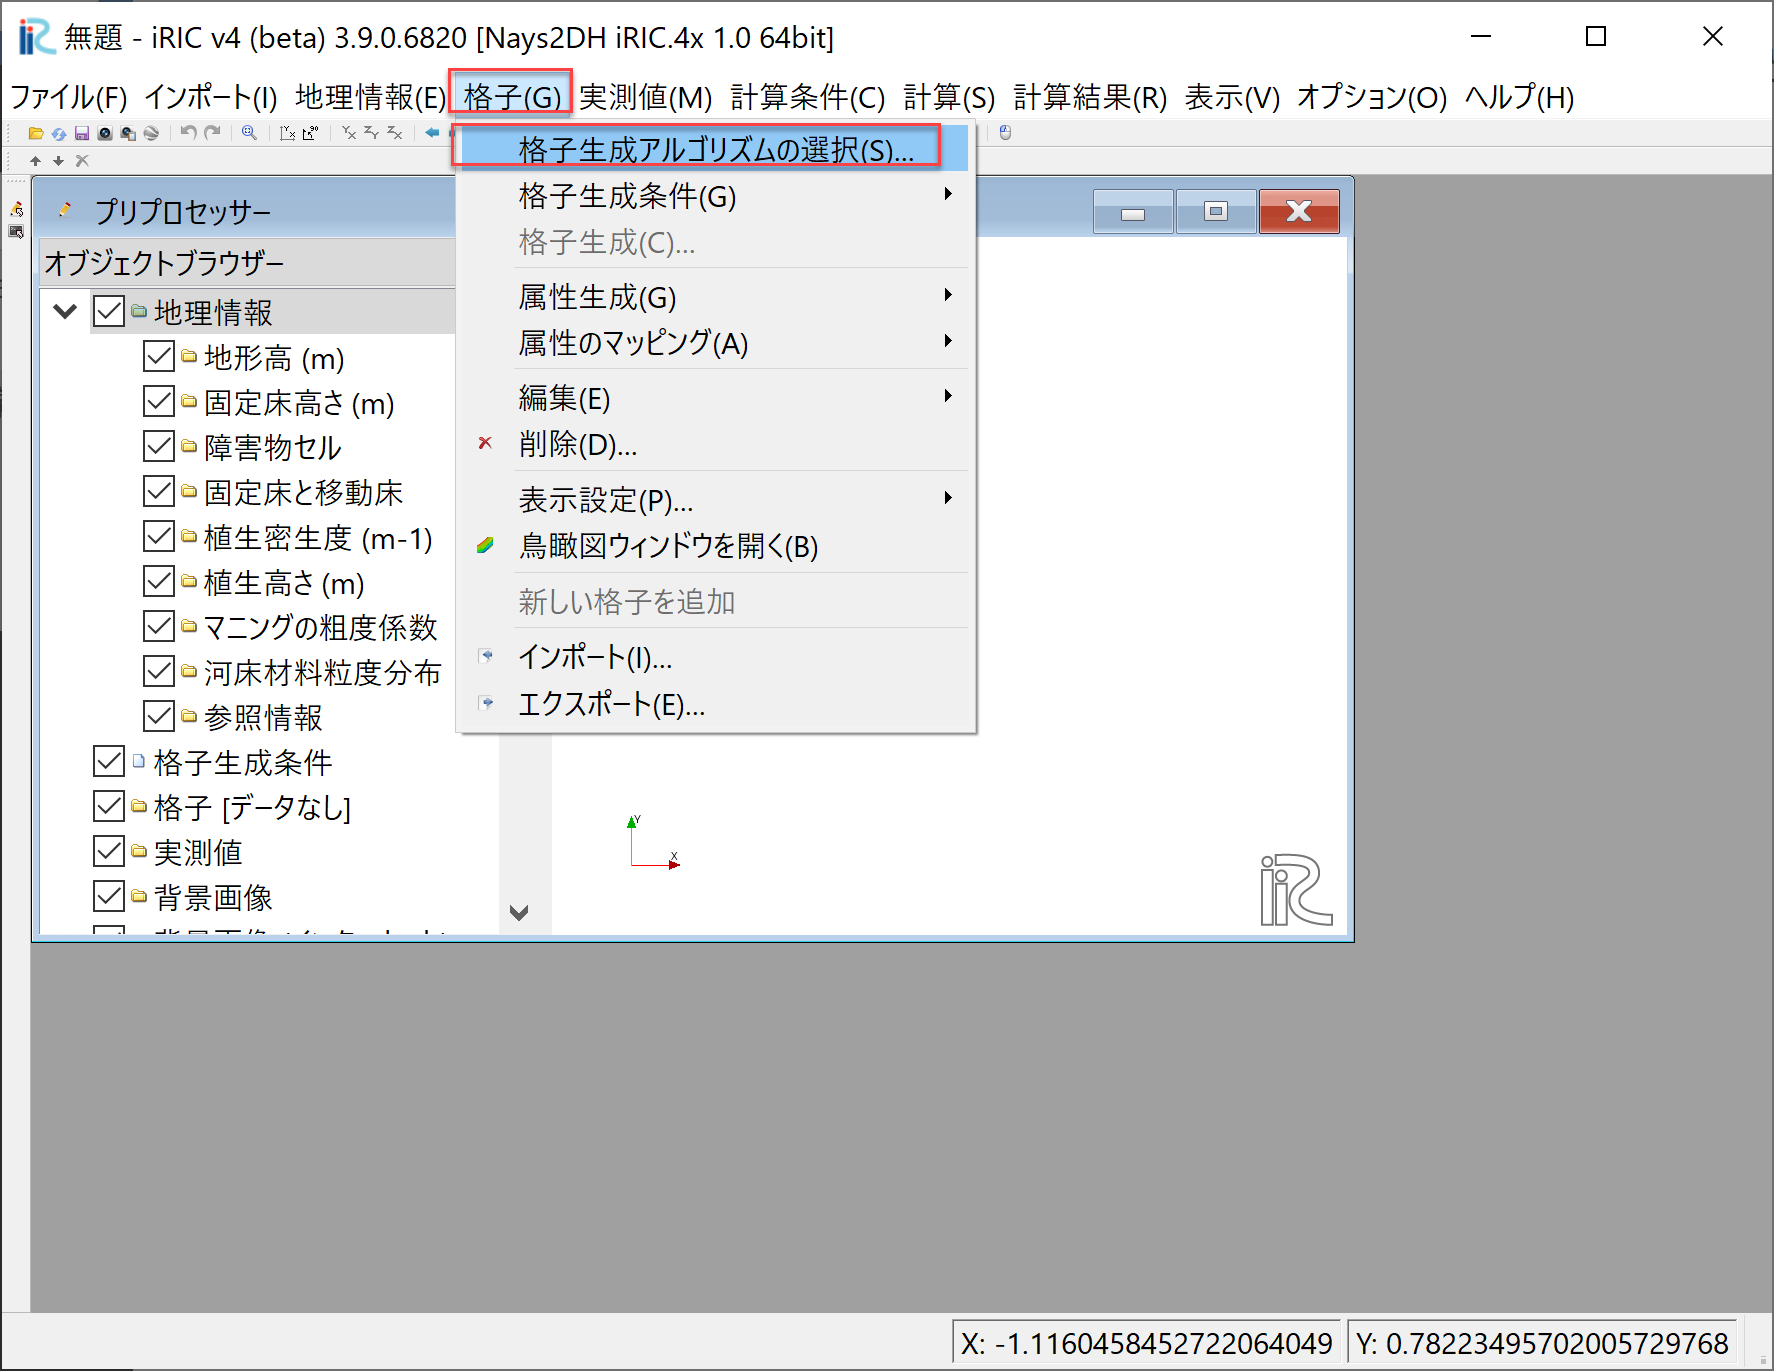
Figure 2.8 : 格子生成アルゴリズムの選択(1)
[格子アルゴリズムの選択]Windowで, [Grid Genarator for Python #2]を選び, [OK]を押します ( Figure 2.9 ).
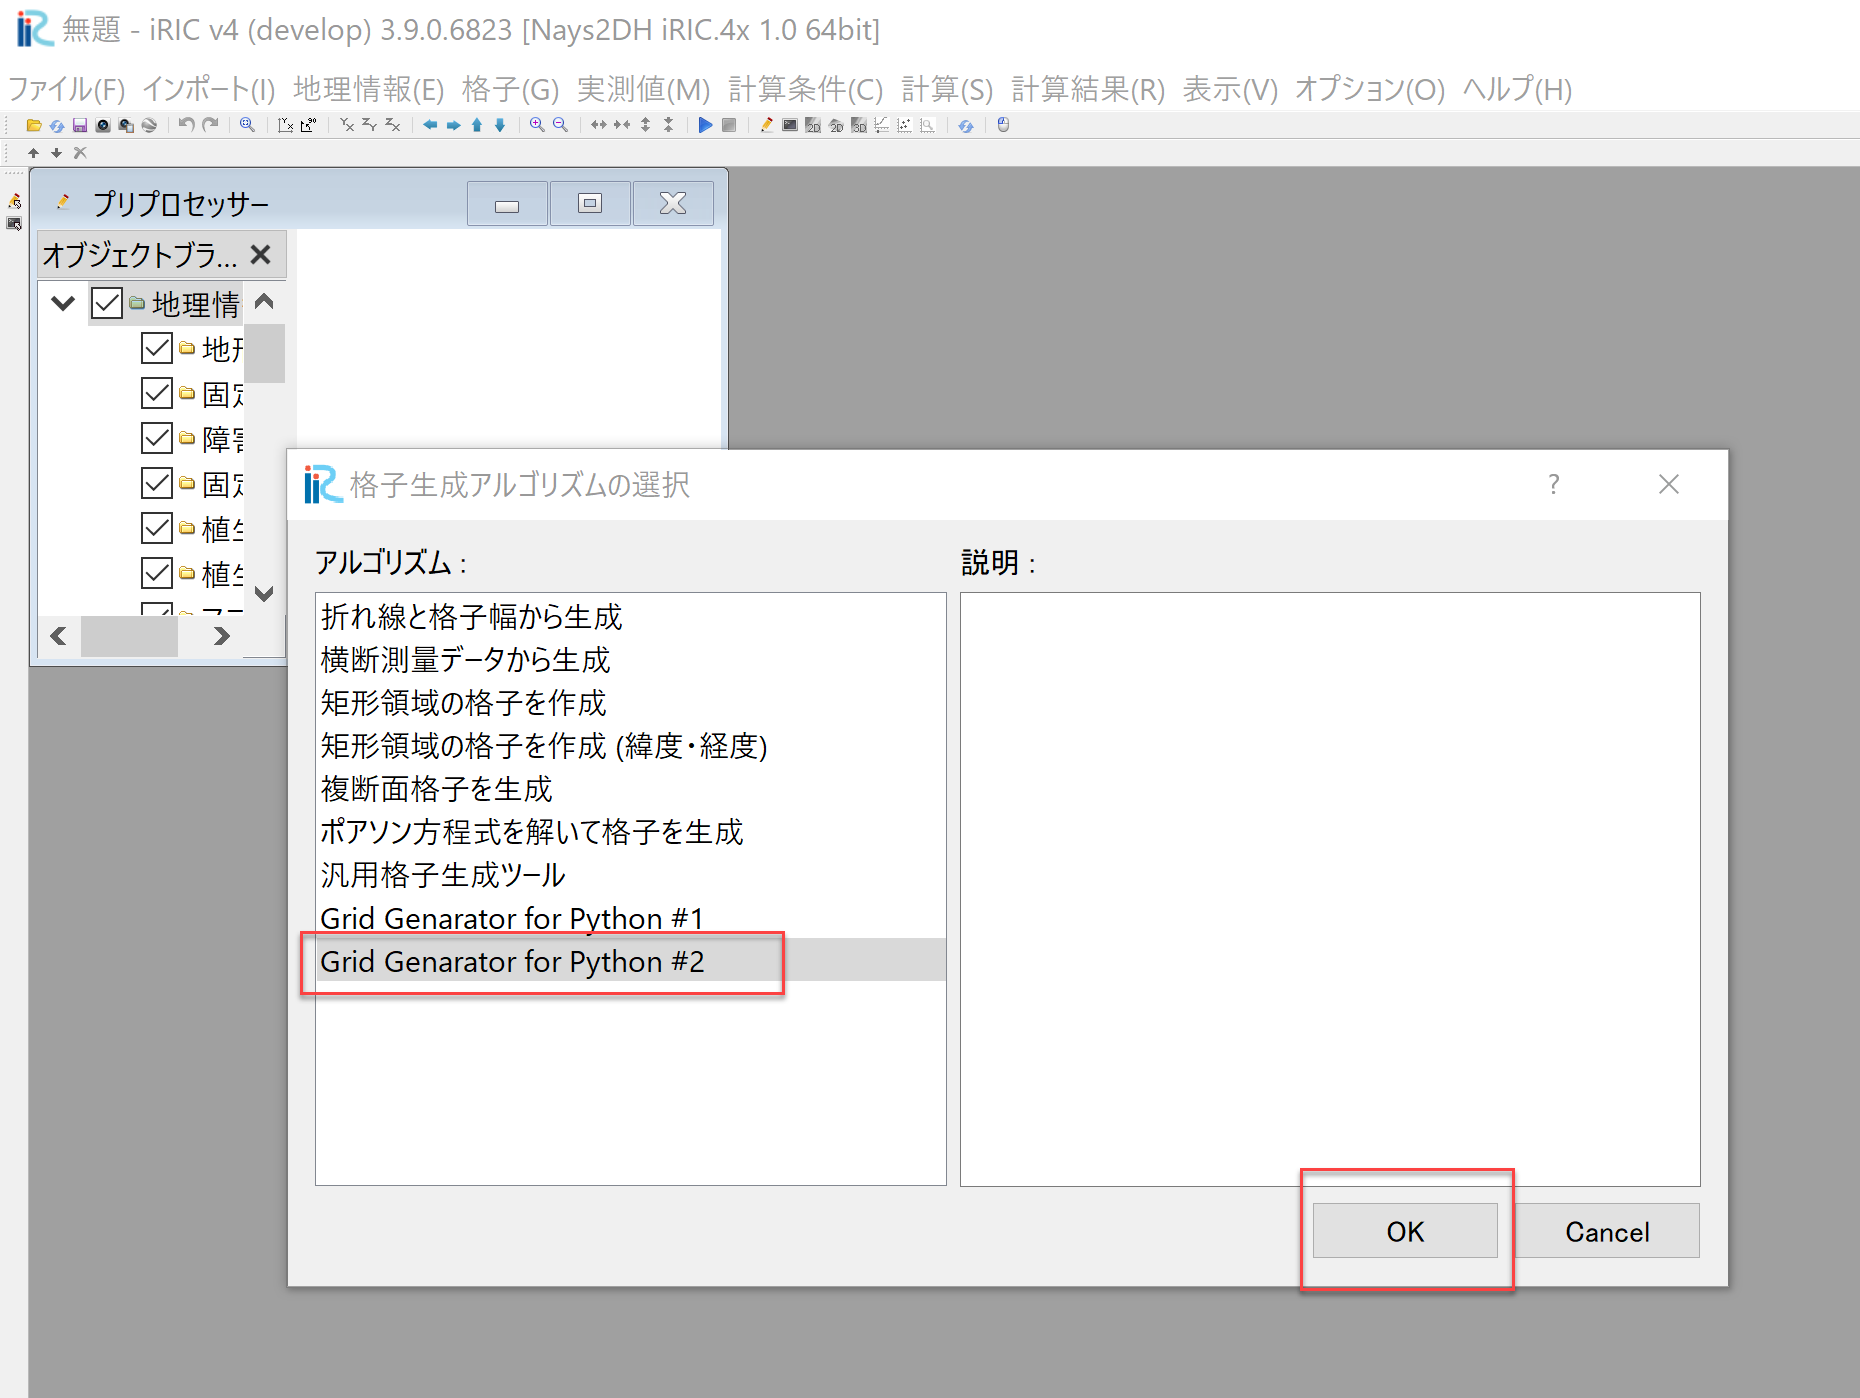
Figure 2.9 : 格子生成アルゴリズムの選択(2)
[格子生成]のパラメーター入力Windowが表示されるので,必要なパラメーターを設定して[格子生成] ボタンを押して下さい.
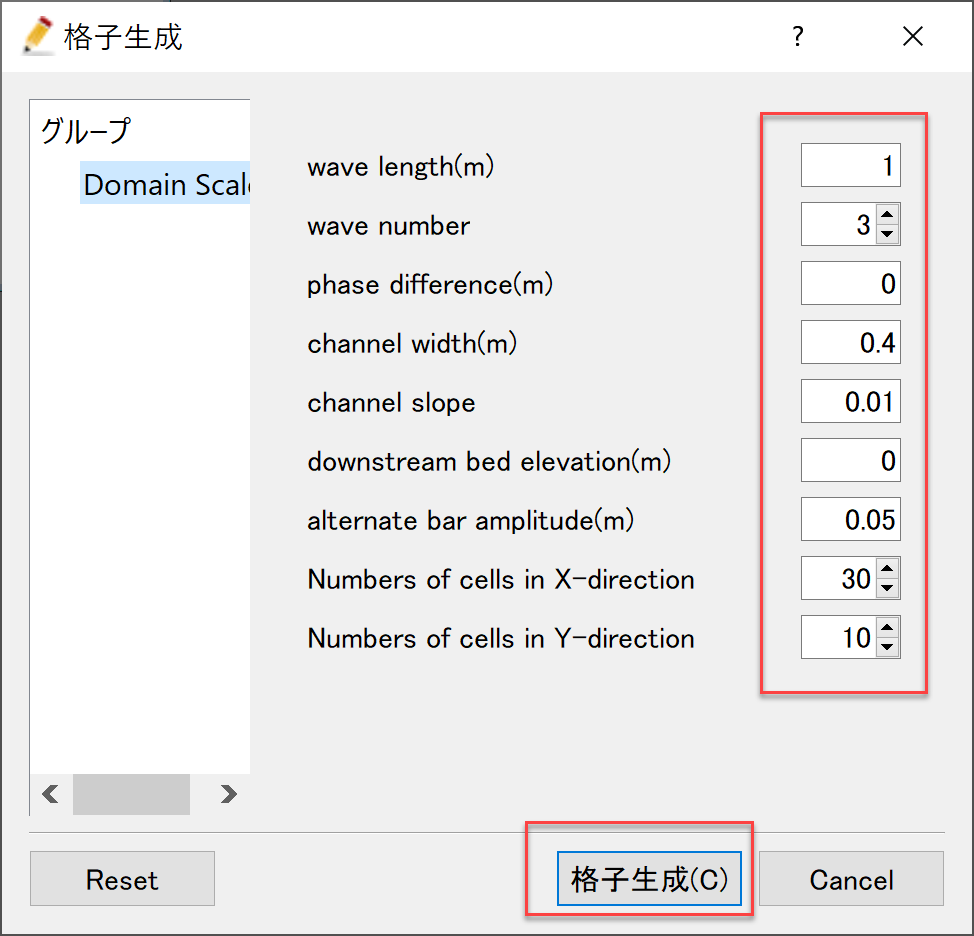
Figure 2.10 : 格子生成パラメーターの指定
マッピング確認のWindowが表示されるので,[Yes]を選択します.

Figure 2.11 : マッピング実行の確認
プリプロセッサーWindowで格子形状が表示されます. 河床高の見るために[格子点の属性]と[地形高(m)]に✓マークを入れると河床コンター図が表示されます.
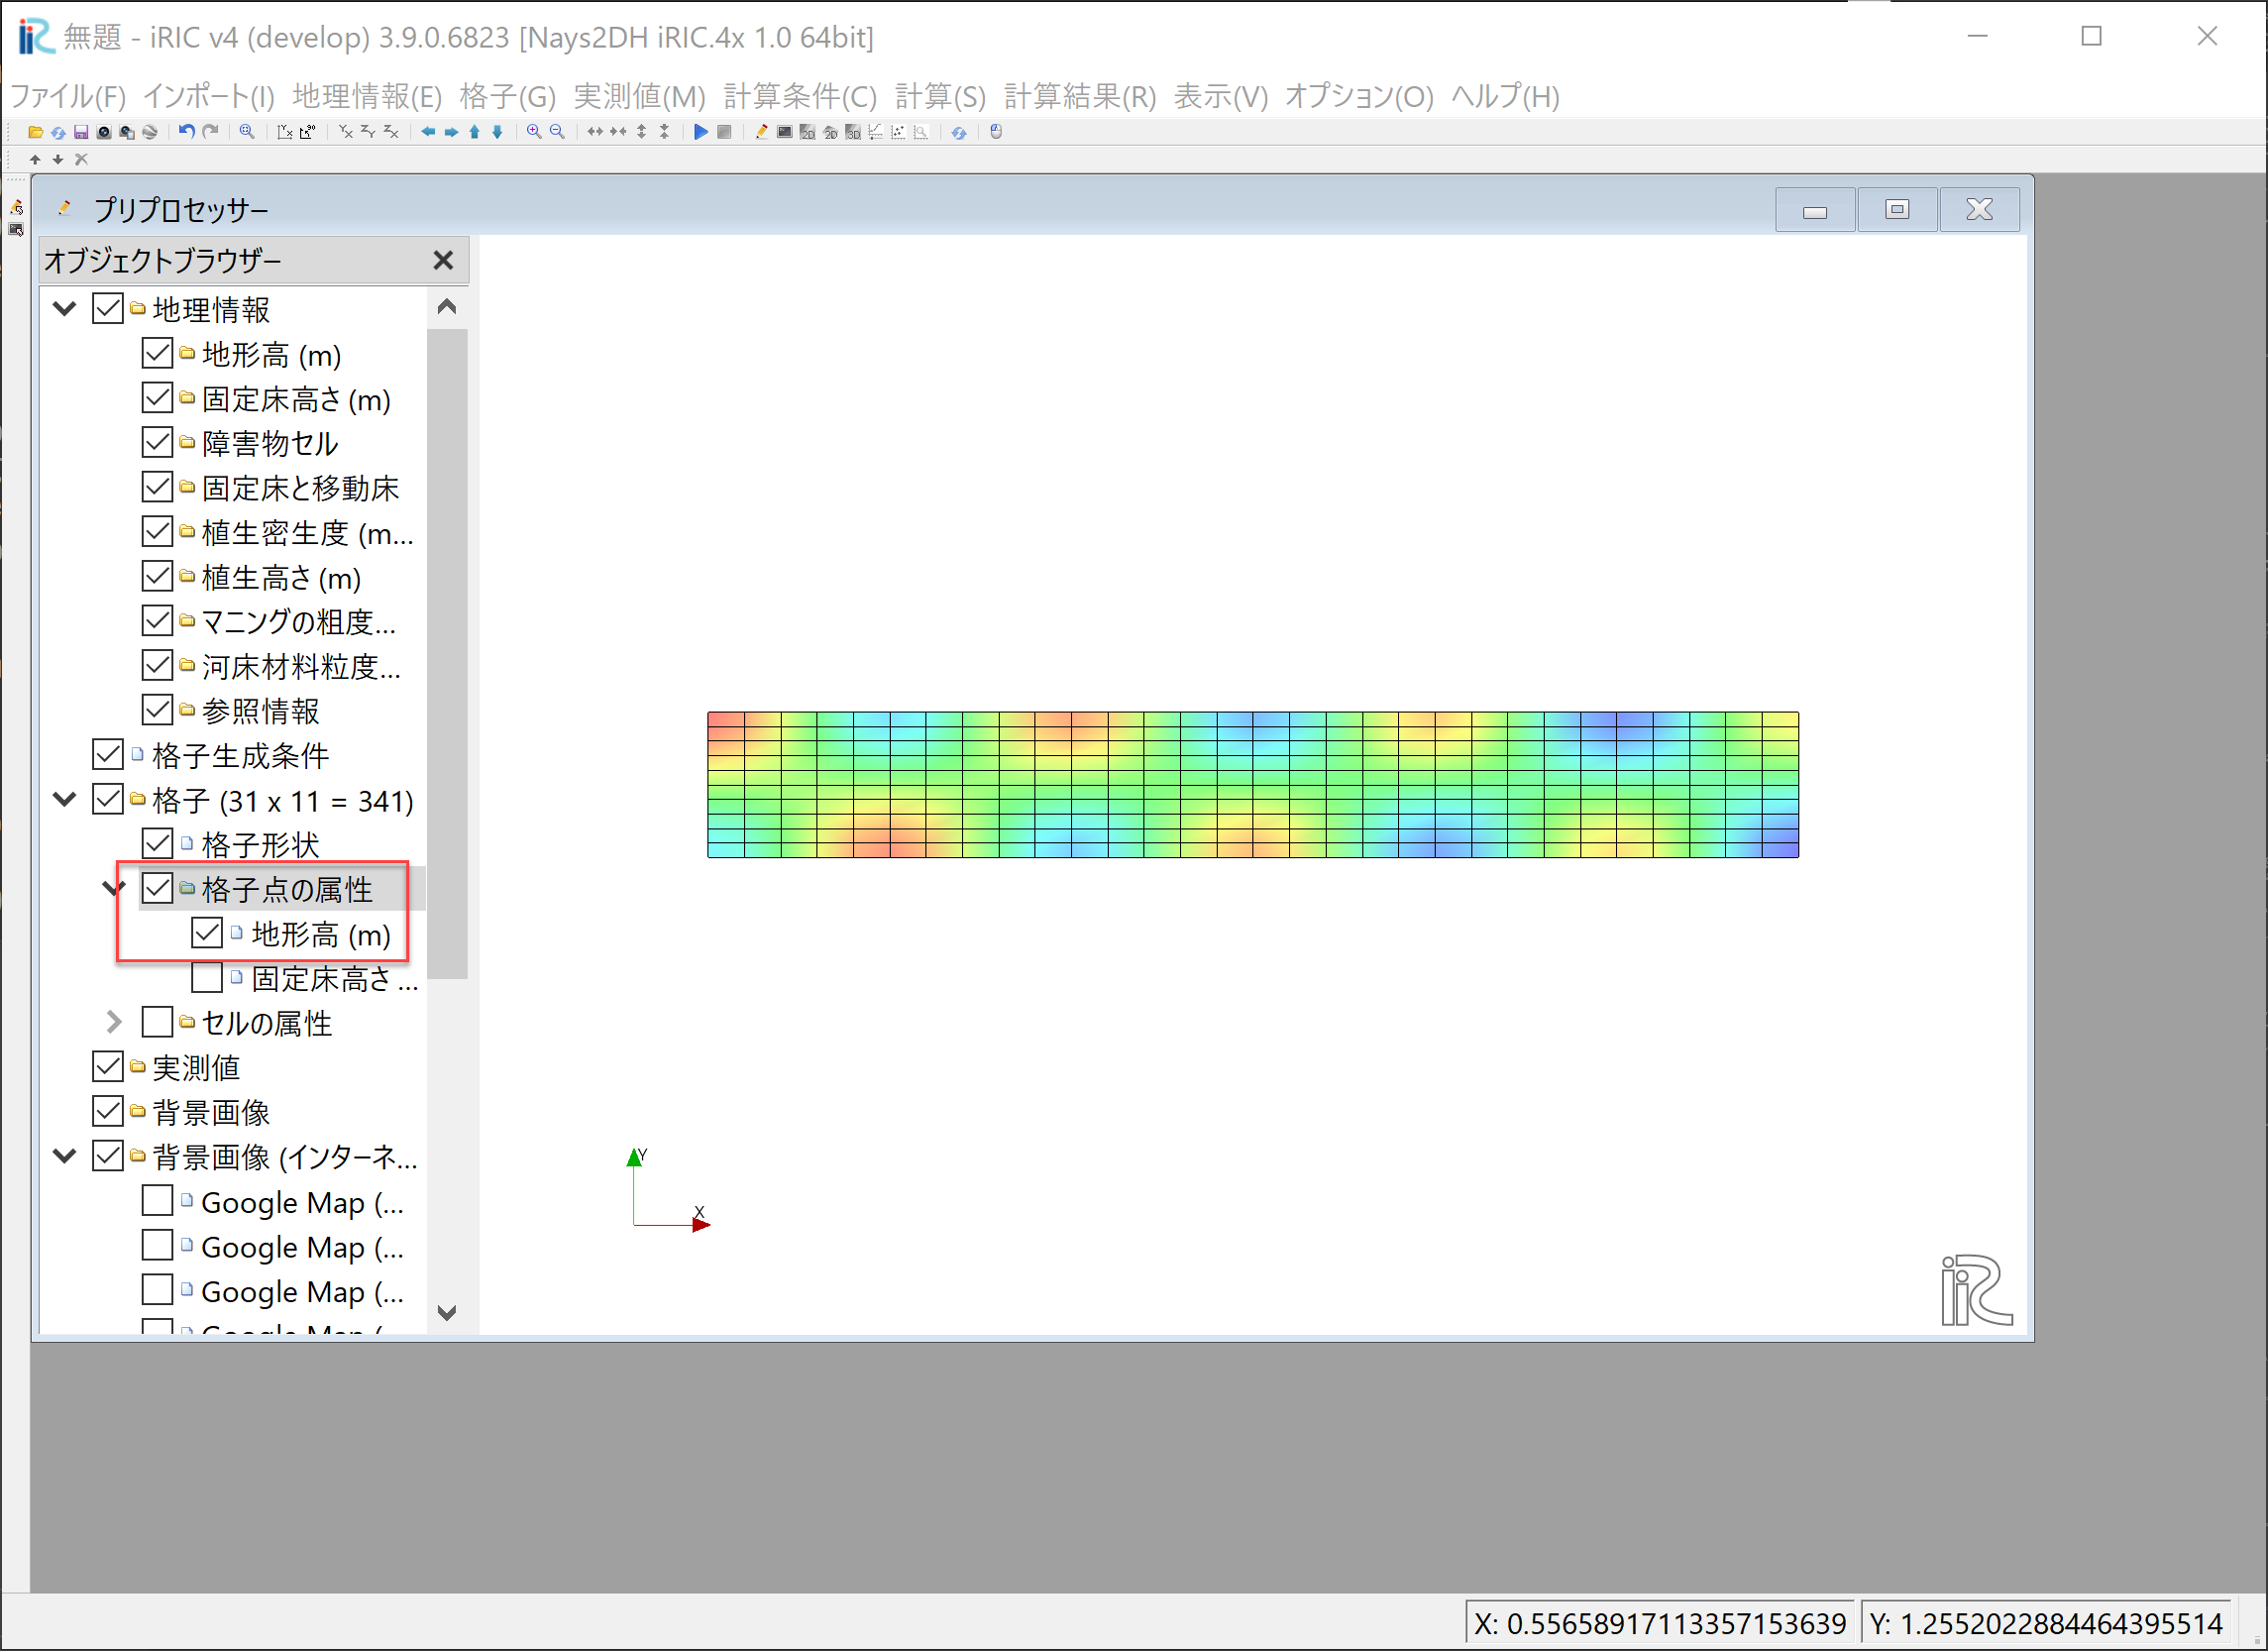
Figure 2.12 : 格子生成の完成
2.3. 蛇行水路(Example 3)
ここでは, https://i-ric.org/yasu/nbook2/08_Chapt08.html#id2 に示される平面形がSin Generated Curve(サインジェネレーッテッド曲線)の水路の計算格子を (1) iRICのGUIでパラメーターを入力し (2) Pythonコードで格子座標を生成し (3) iRICで用いられるCGNSファイルに保存する 方法を示します. Sin Genarated Curveについては, その基礎式, パラメーター, 格子生成方法などについては すべて上記のサイト https://i-ric.org/yasu/nbook2/08_Chapt08.html#id2 で解説済みなので,ここではこれをiRICのGUI上で行う方法を示します.
2.3.1. 格子作成情報定義ファイル
iRIC-V4インストール先の下の "private\gridcreators" に "gc_py_sg" というフォルダを作成し, その中に下記の格子作成情報定義ファイル"default.xml" ファイル を置きます.
<?xml version="1.0" encoding="UTF-8"?>
<GridGeneratorDefinition
xmlns="www.iric.net/GridGeneratorDefinition/1.0"
name="sample_grid_generator_python_sgcurve"
caption="Grid Genarator for Python SG-curve" version="0.1"
copyright="iRIC organization"
executable="gc_py_sg.py"
gridtype="structured2d"
release="2022.6.20"
>
    <GridGeneratingCondition>
    <Tab name="plane" caption="Plane Geometry">
    <Item name="L" caption="Wave length(m)">
        <Definition valueType="real" default="1" max="10000" min="0" />
    </Item>
    <Item name="m" caption="Wave number">
        <Definition valueType="integer" default="2" max="10000" min="1" />
    </Item>
    <Item name="B" caption="Channel width(m)">
        <Definition valueType="real" default="0.2" max="10000" min="0" />
    </Item>
    <Item name="t0" caption="Maximum meander angle(degree)">
        <Definition valueType="real" default="40" max="180" min="0" />
    </Item>
    <Item name="nx0" caption="Numbers of cells per one wave length in S-direction">
        <Definition valueType="integer" default="20" max="10000" min="1" />
    </Item>
    <Item name="ny" caption="Numbers of cells in Y-direction">
        <Definition valueType="integer" default="10" max="10000" min="1" />
    </Item>
    </Tab>

    <Tab name="bed" caption="Bed Topography">
    <Item name="j_bar" caption="Bed Shape">
            <Definition conditionType="constant" valueType="integer" option="true" default="1">
                <Enumerations>
                    <Enumeration value="1" caption="Flat (no bar)"/>
                    <Enumeration value="2" caption="Alternate Bar"/>
                    <Enumeration value="3" caption="Parabolic Shape"/>
                </Enumerations>
            </Definition>
        </Item>
        <Item name="ap" caption="Bar Height or Amplitude of Parabolic Shape(m)">
            <Definition conditionType="constant" valueType="real" option="false" default="0.01">
            <Dependency>
                <Condition type="isGreaterThan" target="j_bar" value="1"/>
            </Dependency>
            </Definition>
        </Item>
        <Item name="lag" caption="Lag Between Bar and Plane Geometry(m)">
            <Definition conditionType="constant" valueType="real" option="false" default="0.05">
            <Dependency>
                <Condition type="isEqual" target="j_bar" value="2"/>
            </Dependency>
            </Definition>
        </Item>
    </Tab>

    <Tab name="longitude" caption="Longitudinal Profile">
    <Item name="slope" caption="channel slope">
        <Definition valueType="real" default="0.01"/>
    </Item>
    <Item name="elv_d" caption="downstream bed elevation(m)">
        <Definition valueType="real" default="0"/>
    </Item>
    </Tab>
    </GridGeneratingCondition>
</GridGeneratorDefinition>
2.3.2. 格子生成用Pythonコード
上記で作成した "gc_py_sg" というフォルダに下記の格子作成用のPythonコードファイル "gc_py_sg.py" を置きます.
import sys,csv
import numpy as np

from iric import *

def main(cgnsName: str):

    fid = cg_iRIC_Open(cgnsName, IRIC_MODE_MODIFY)

    wl=cg_iRIC_Read_Real(fid,"L")
    wn=cg_iRIC_Read_Integer(fid,"m")
    width=cg_iRIC_Read_Real(fid,"B")
    t0=cg_iRIC_Read_Real(fid,"t0")
    nx0=cg_iRIC_Read_Integer(fid, "nx0")
    ny=cg_iRIC_Read_Integer(fid, "ny")
    j_bar=cg_iRIC_Read_Integer(fid, "j_bar")
    ap=cg_iRIC_Read_Real(fid,"ap")
    lag=cg_iRIC_Read_Real(fid,"lag")
    slope=cg_iRIC_Read_Real(fid,"slope")
    elv_d=cg_iRIC_Read_Real(fid,"elv_d")

    ds=wl/float(nx0); dds=ds/10.
    nx=nx0*wn; chl=wl*float(wn)
    pi=np.pi
    a_ptv=4.*ap/width**2
    isize=nx+1;jsize=ny+1
    x = np.zeros((isize, jsize))
    y = np.zeros((isize, jsize))
    dz = np.zeros((isize, jsize)); zb = np.zeros((isize, jsize))
    zflat =np.zeros((isize))

    xr=np.zeros(isize);xl=np.zeros(isize);xcenter=np.zeros(isize)
    yr=np.zeros(isize);yl=np.zeros(isize);ycenter=np.zeros(isize)
    tcenter=np.zeros(isize);scenter=np.zeros(isize)


    theta0=np.radians(t0)
    xpath=0.;ypath=0.;spath=0.

    xcenter[0]=xpath;ycenter[0]=ypath;scenter[0]=spath
    tcenter[0]=theta0*np.sin(2.*pi*scenter[0]/wl)


    for i in np.arange(1,isize):
        for j in np.arange(1,11):
            spath=spath+dds
            theta=theta0*np.sin(2.*np.pi*spath/wl)
            xpath=xpath+dds*np.cos(theta)
            ypath=ypath+dds*np.sin(theta)
        xcenter[i]=xpath;ycenter[i]=ypath
        tcenter[i]=theta;scenter[i]=spath

    for i in np.arange(0,isize):
        zflat[i]=elv_d+(chl-scenter[i])*slope
        xr[i]=xcenter[i]+width/2.*np.sin(tcenter[i])
        yr[i]=ycenter[i]-width/2.*np.cos(tcenter[i])
        xl[i]=xcenter[i]-width/2.*np.sin(tcenter[i])
        yl[i]=ycenter[i]+width/2.*np.cos(tcenter[i])

        for j in np.arange(0,jsize):
            ss=float(j)/float(ny)
            x[i,j]=xr[i]+ss*(xl[i]-xr[i])
            y[i,j]=yr[i]+ss*(yl[i]-yr[i])
            if j_bar==1:
                dz[i,j]=0.
            elif j_bar==2:
                dz[i,j]=-ap*np.cos(2.*pi/wl*scenter[i]-lag) \
                *np.cos(pi*ss)
            elif j_bar==3:
                yc2=(x[i,j]-xcenter[i])**2+(y[i,j]-ycenter[i])**2
                dz[i,j]=a_ptv*yc2

            zb[i,j]=zflat[i]+dz[i,j]

    x2 = np.reshape(x, (isize * jsize), order='F')
    y2 = np.reshape(y, (isize * jsize), order='F')
    z2 = np.reshape(zb, (isize * jsize), order='F')

    cg_iRIC_Write_Grid2d_Coords(fid, isize, jsize, x2, y2)
    cg_iRIC_Write_Grid_Real_Node(fid, "Elevation", z2)
    cg_iRIC_Close(fid)

if __name__ == '__main__':
    if len(sys.argv) < 2:
        print("Error: CGNS file name not specified.")
        exit()
    cgnsName = sys.argv[1]
    main(cgnsName)
2.3.3. 蛇行水路格子生成ツールのインストール
本節で述べた蛇行水路生成用のdefault.xmlとPythonコードを https://github.com/YasuShimizu/gc_py_sg で共有してます.なお,このリポジトリにはGUI入力画面の日本語化ようファイル"translation_ja_JP.ts", ツールの説明ファイル"README"およびその日本語版"README_ja_JP"も含まれてます.
インストールは[iRIC-Version4]のインストールフォルダ"/private/gridcreators/" に"gc_py_sg"というフォルダを作成し,その中に上記リポジトリ中のすべてのファイルをコピーすることにより iRICへのインストールが完了します.
2.3.4. 格子生成の実行と確認
デスクトップ上にある iRIC Version 4 を起動後, [新しいプロジェクト]を選択します( Figure 2.13 ).
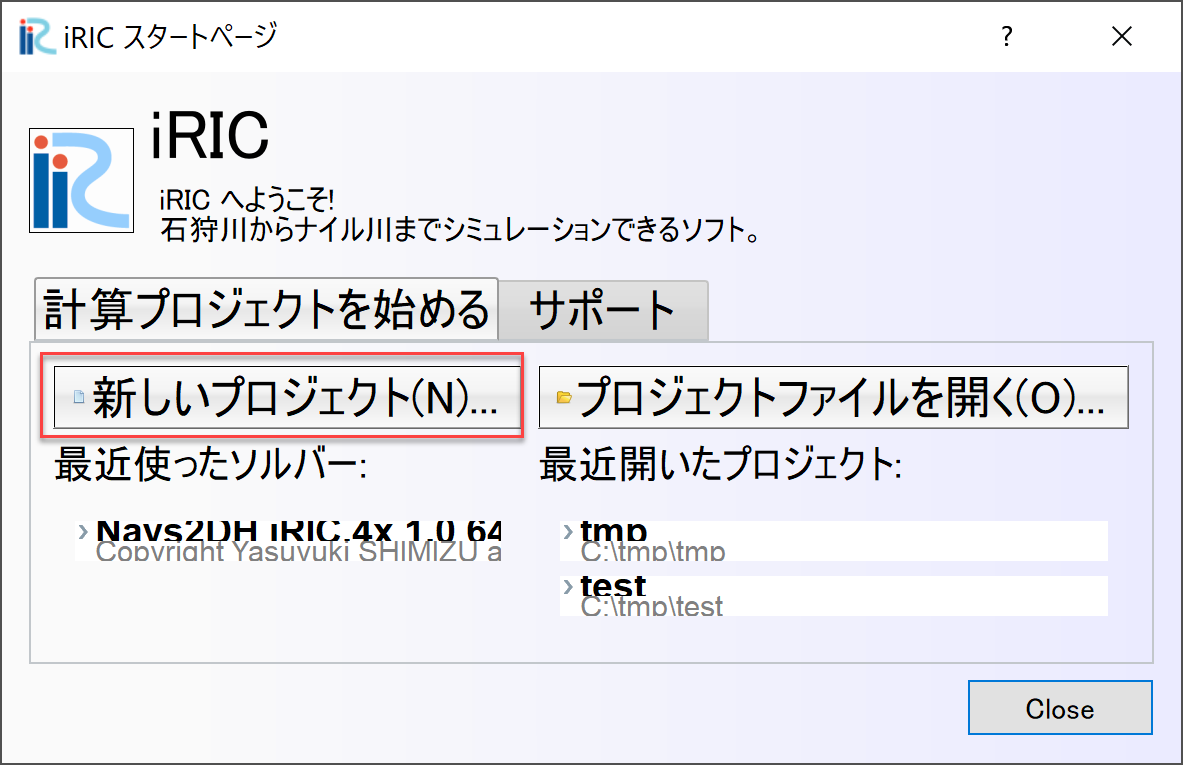
Figure 2.13 : 新しいプロジェクト
ソルバー選択Windowで,(ソルバーは何でも良いのですが) [Nays2dH]を選択し, [OK]ボタンを押します( Figure 2.14 ).
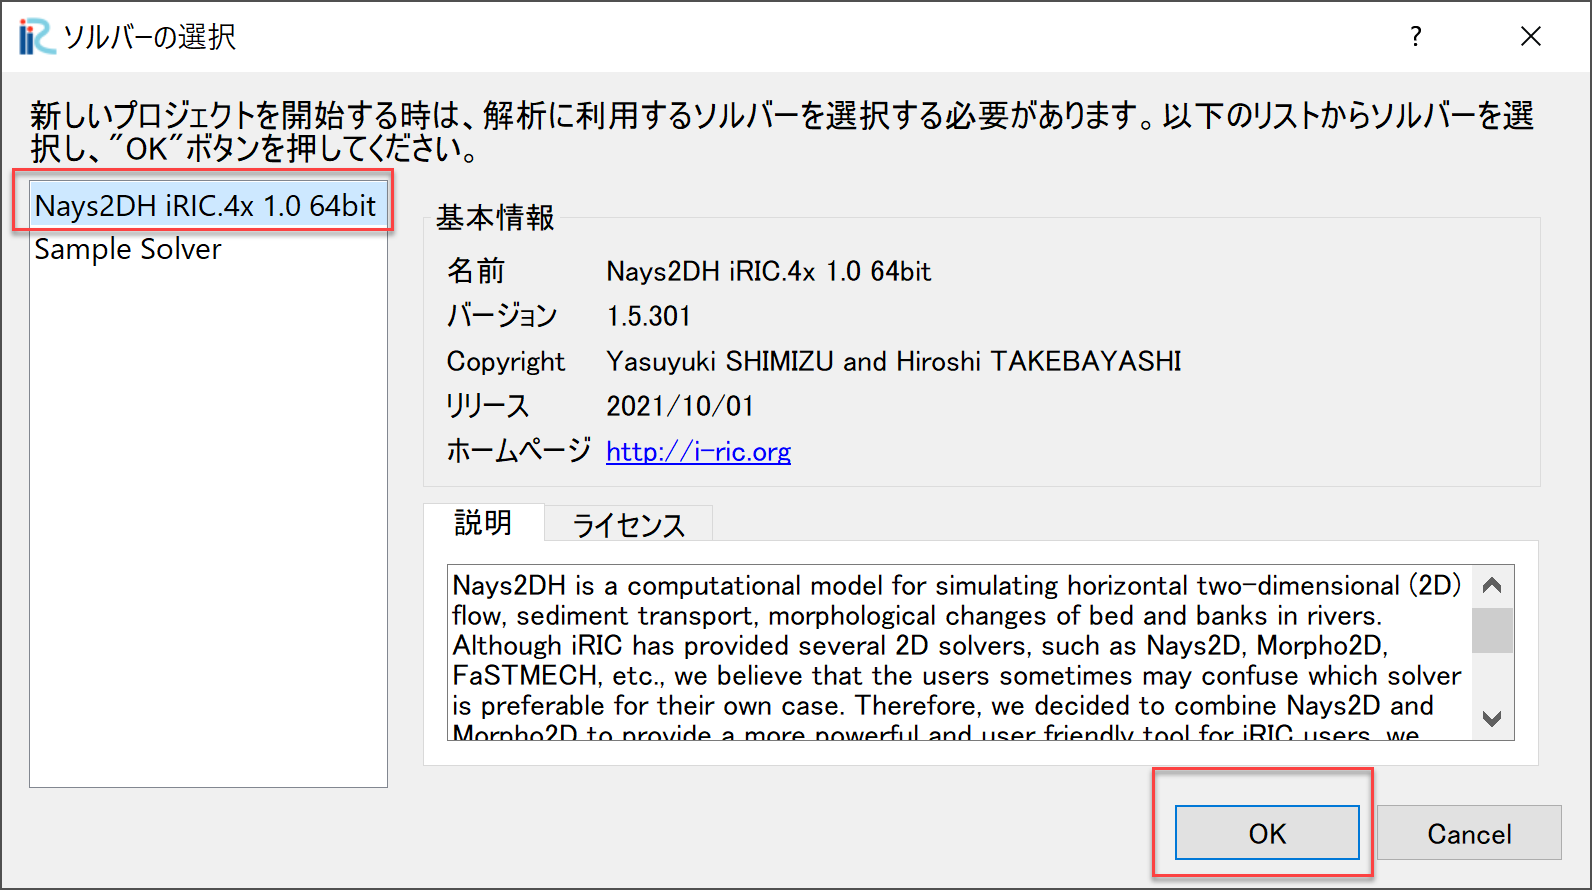
Figure 2.14 : ソルバーの選択
[格子]→[格子生成アルゴリズムの選択]を選びます( Figure 2.15 ).
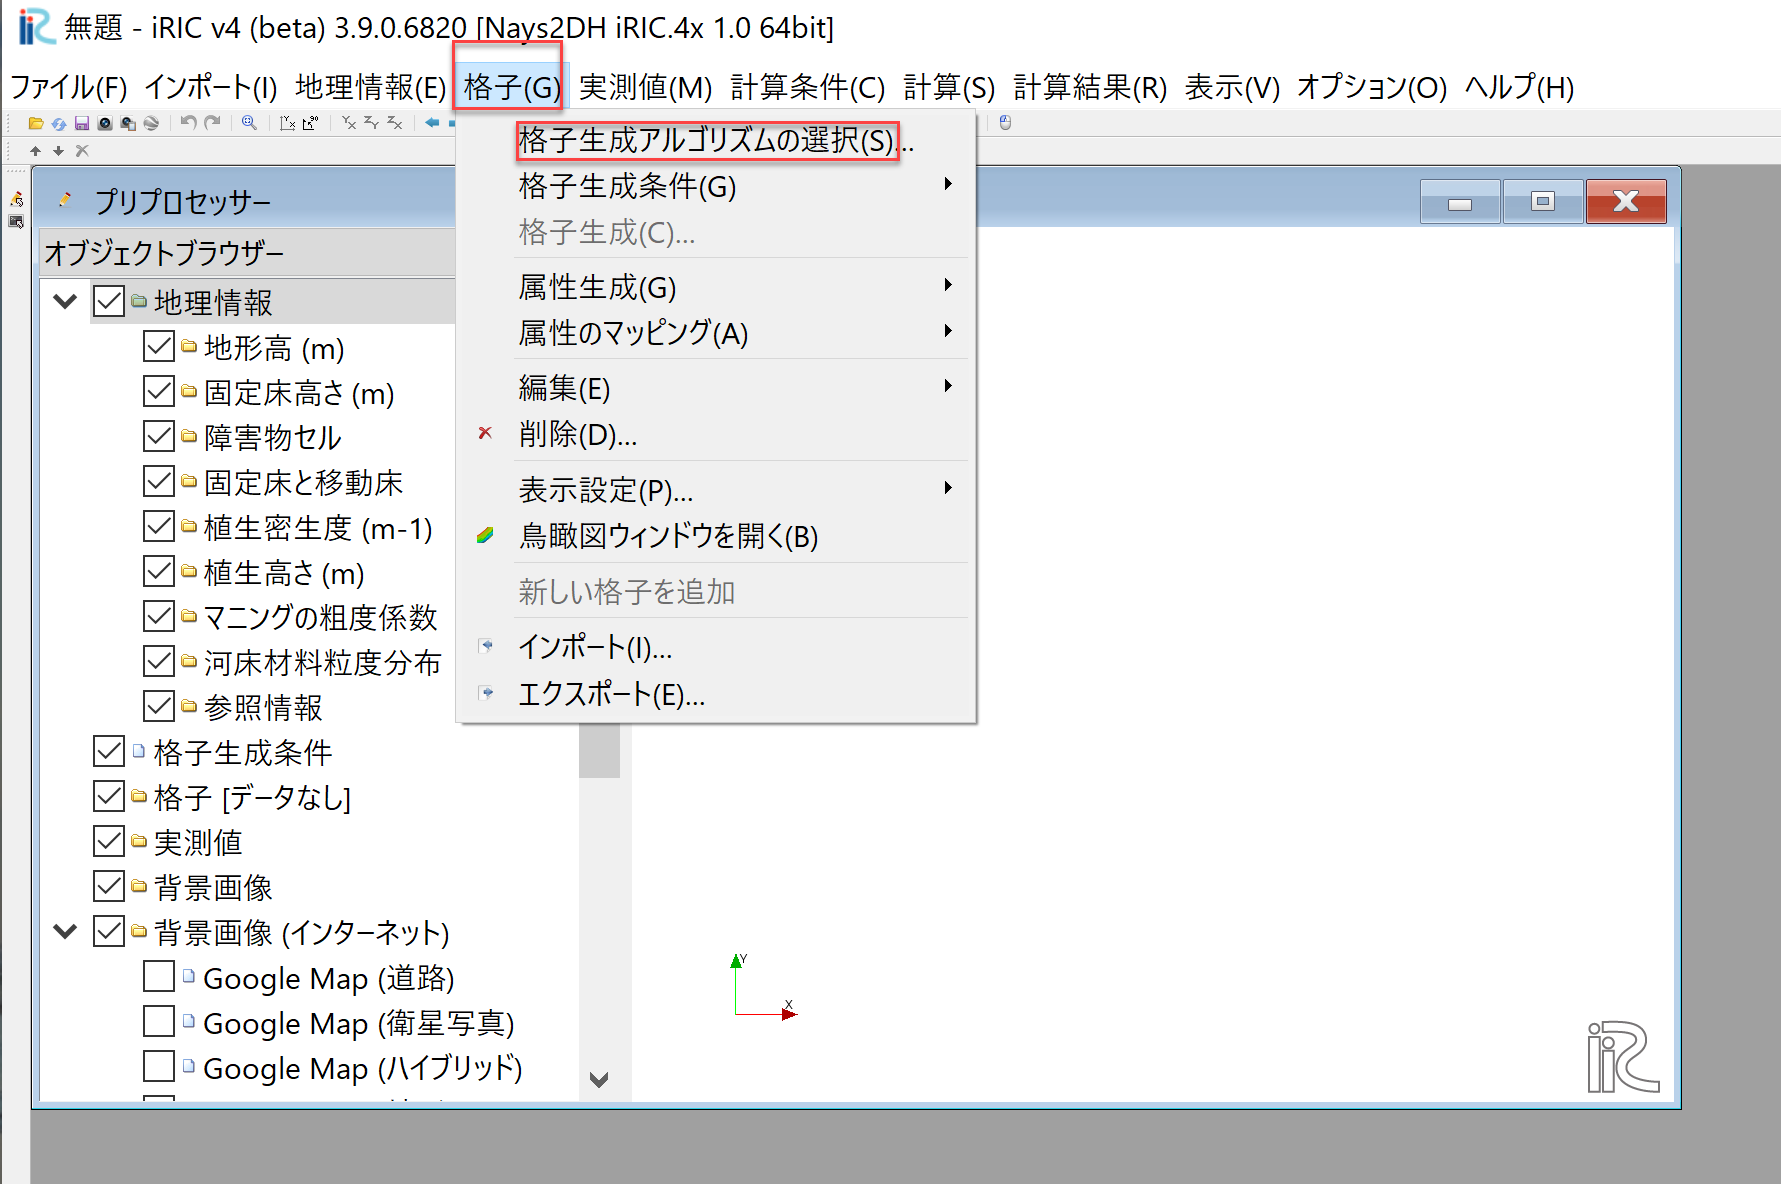
Figure 2.15 : 格子生成アルゴリズムの選択(1)
[格子アルゴリズムの選択]Windowで, [Pythonで書かれた格子生成ツール]を選び, [OK]を押します ( Figure 2.16 ).
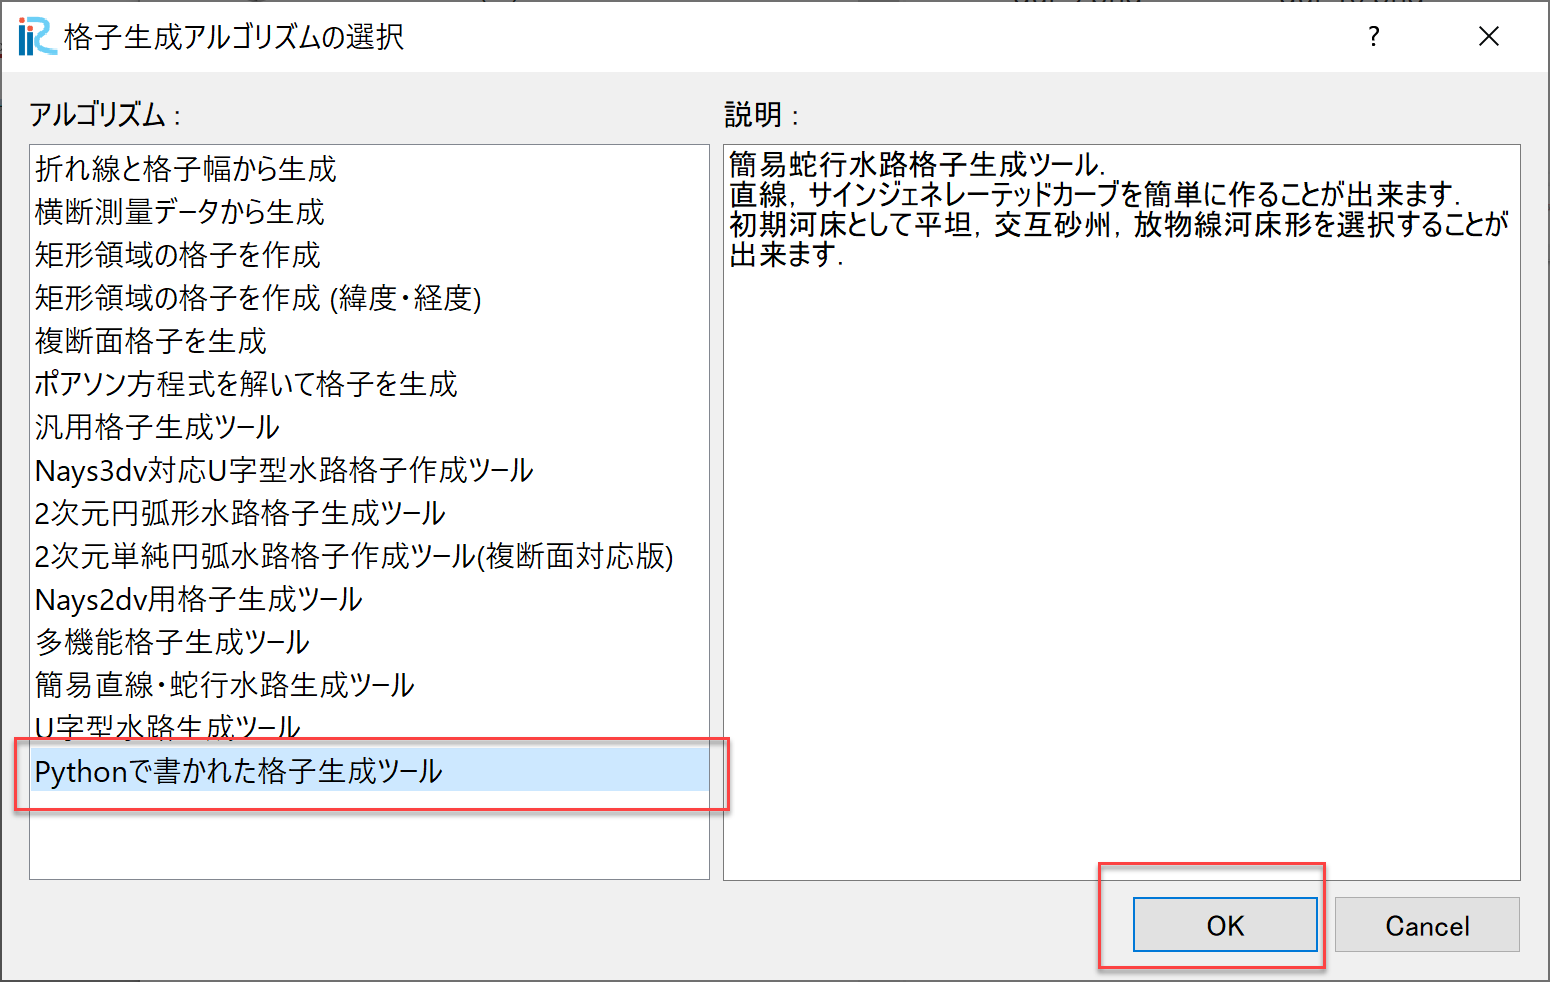
Figure 2.16 : 格子生成アルゴリズムの選択(2)
[格子生成]のパラメーター入力Windowが表示されるので,必要なパラメーターを設定します..
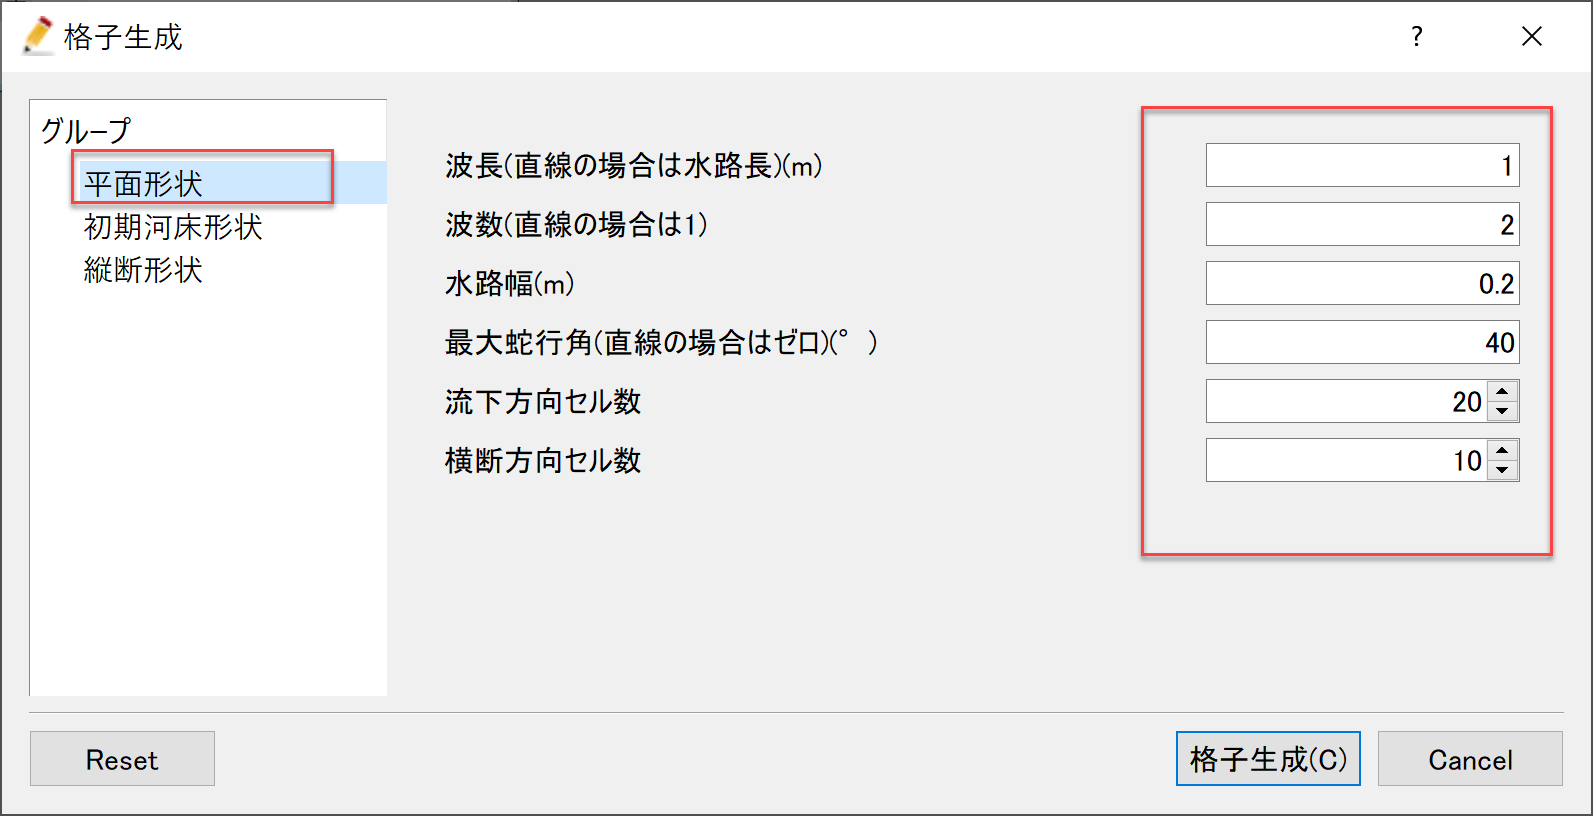
Figure 2.17 : 格子生成条件の入力(1) Plane Geometry
最初に[グループ]の[平面形状]を選択し,平面形状に関するパラメーターを入力します ( Figure 2.17 ). 各パラメーターの意味とここで与えた値は下表のとおりです.
パラメータ名 |
英語名 |
値 |
|---|---|---|
蛇行波長 |
Wave length(m) |
1m |
波数 |
Wave number |
2 |
水路幅 |
Channel width(m) |
0.2m |
最大蛇行角 |
Maximum meander angle(degree) |
40° |
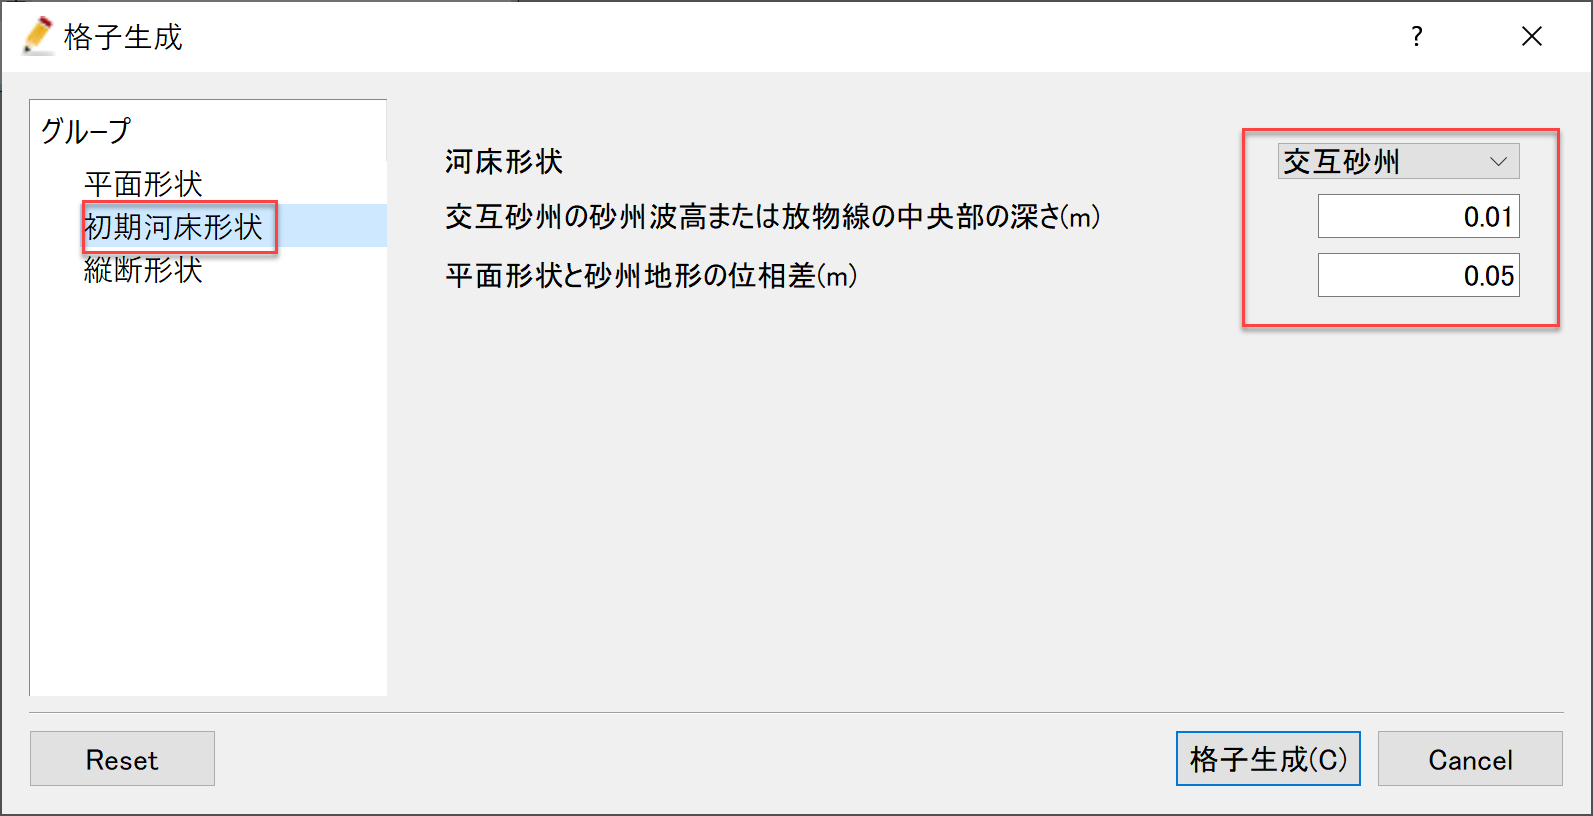
Figure 2.18 : 格子生成条件の入力(2) Bed Topography
に[グループ]の[初期河床形状]を選択し,底面形状に関するパラメーターを入力します ( Figure 2.18 ). 各パラメーターの意味とここで与えた値は下表のとおりです.
パラメータ名 |
英語名 |
値 |
|---|---|---|
河床形状 |
Bed Shape |
Alternate Bar (交互砂州) |
波高 |
Bar Height(m) |
0.01m |
平面形状と河床形状の位相差 |
Lag Between Bar and Plane Geometry(m) |
0.05m |
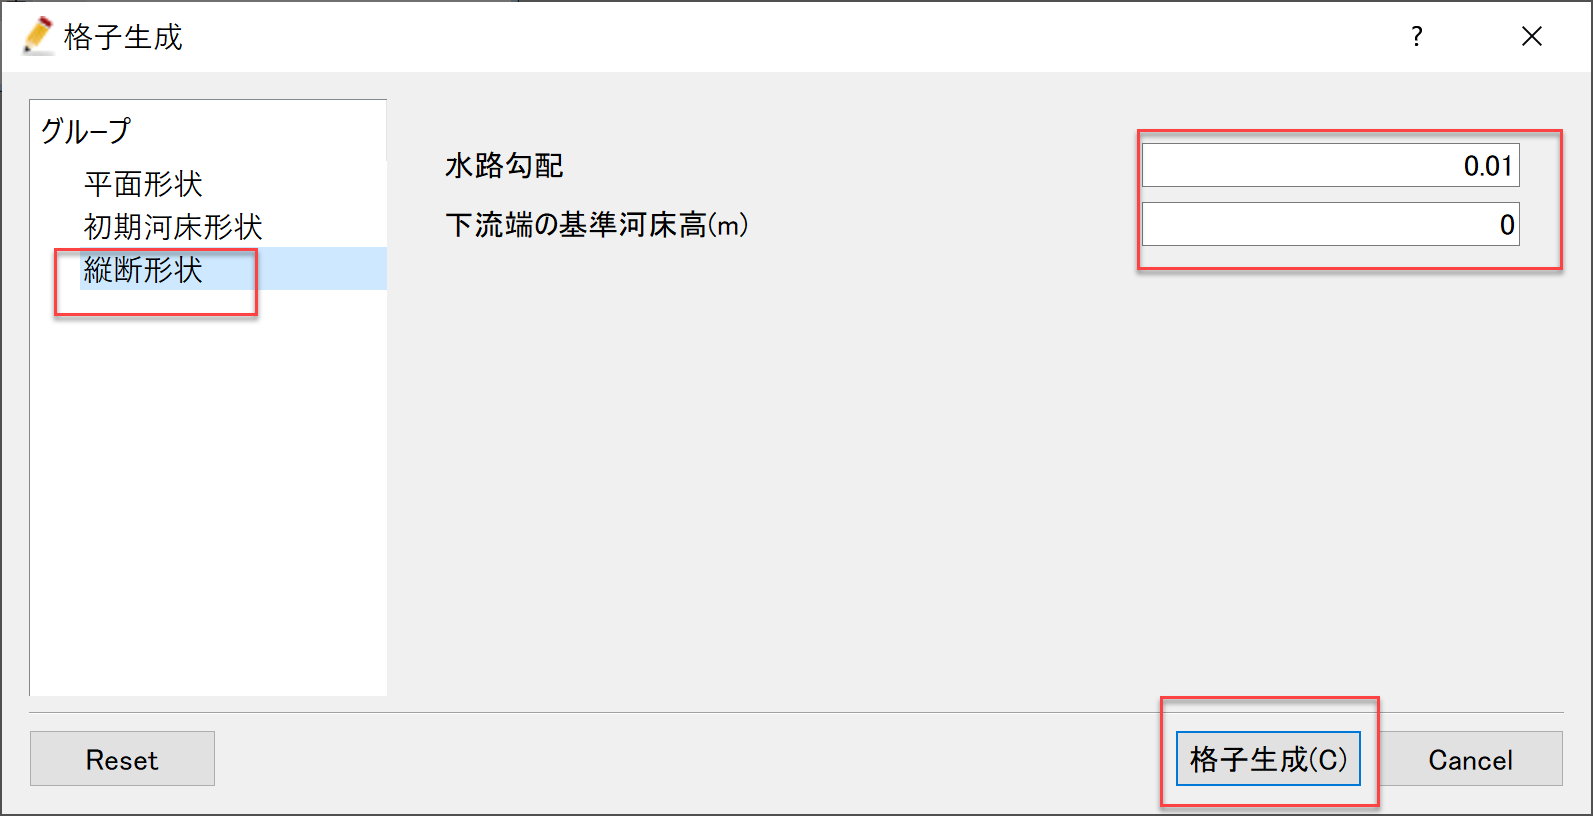
Figure 2.19 : 格子生成条件の入力(3) Longitudinal Proile
最後に[グループ]の[縦断形状]を選択し,縦断形状に関するパラメーターを入力します ( Figure 2.19 ). 各パラメーターの意味とここで与えた値は下表のとおりです.
パラメータ名 |
英語名 |
値 |
|---|---|---|
水路勾配 |
channel slope |
0.01 |
下流端での河床高 |
Downstream Bed Elevation(m) |
0m |
全て入力後に[格子生成]を押します ( Figure 2.19 ).
Figure 2.20 に示すようなWindowが現れマッピングをするかどうか聞かれますので, [Yes]を押してください.

Figure 2.20 : マッピングをしますか?
プリプロセッサーWindowで生成された計算格子が表示されます( Figure 2.21 ).
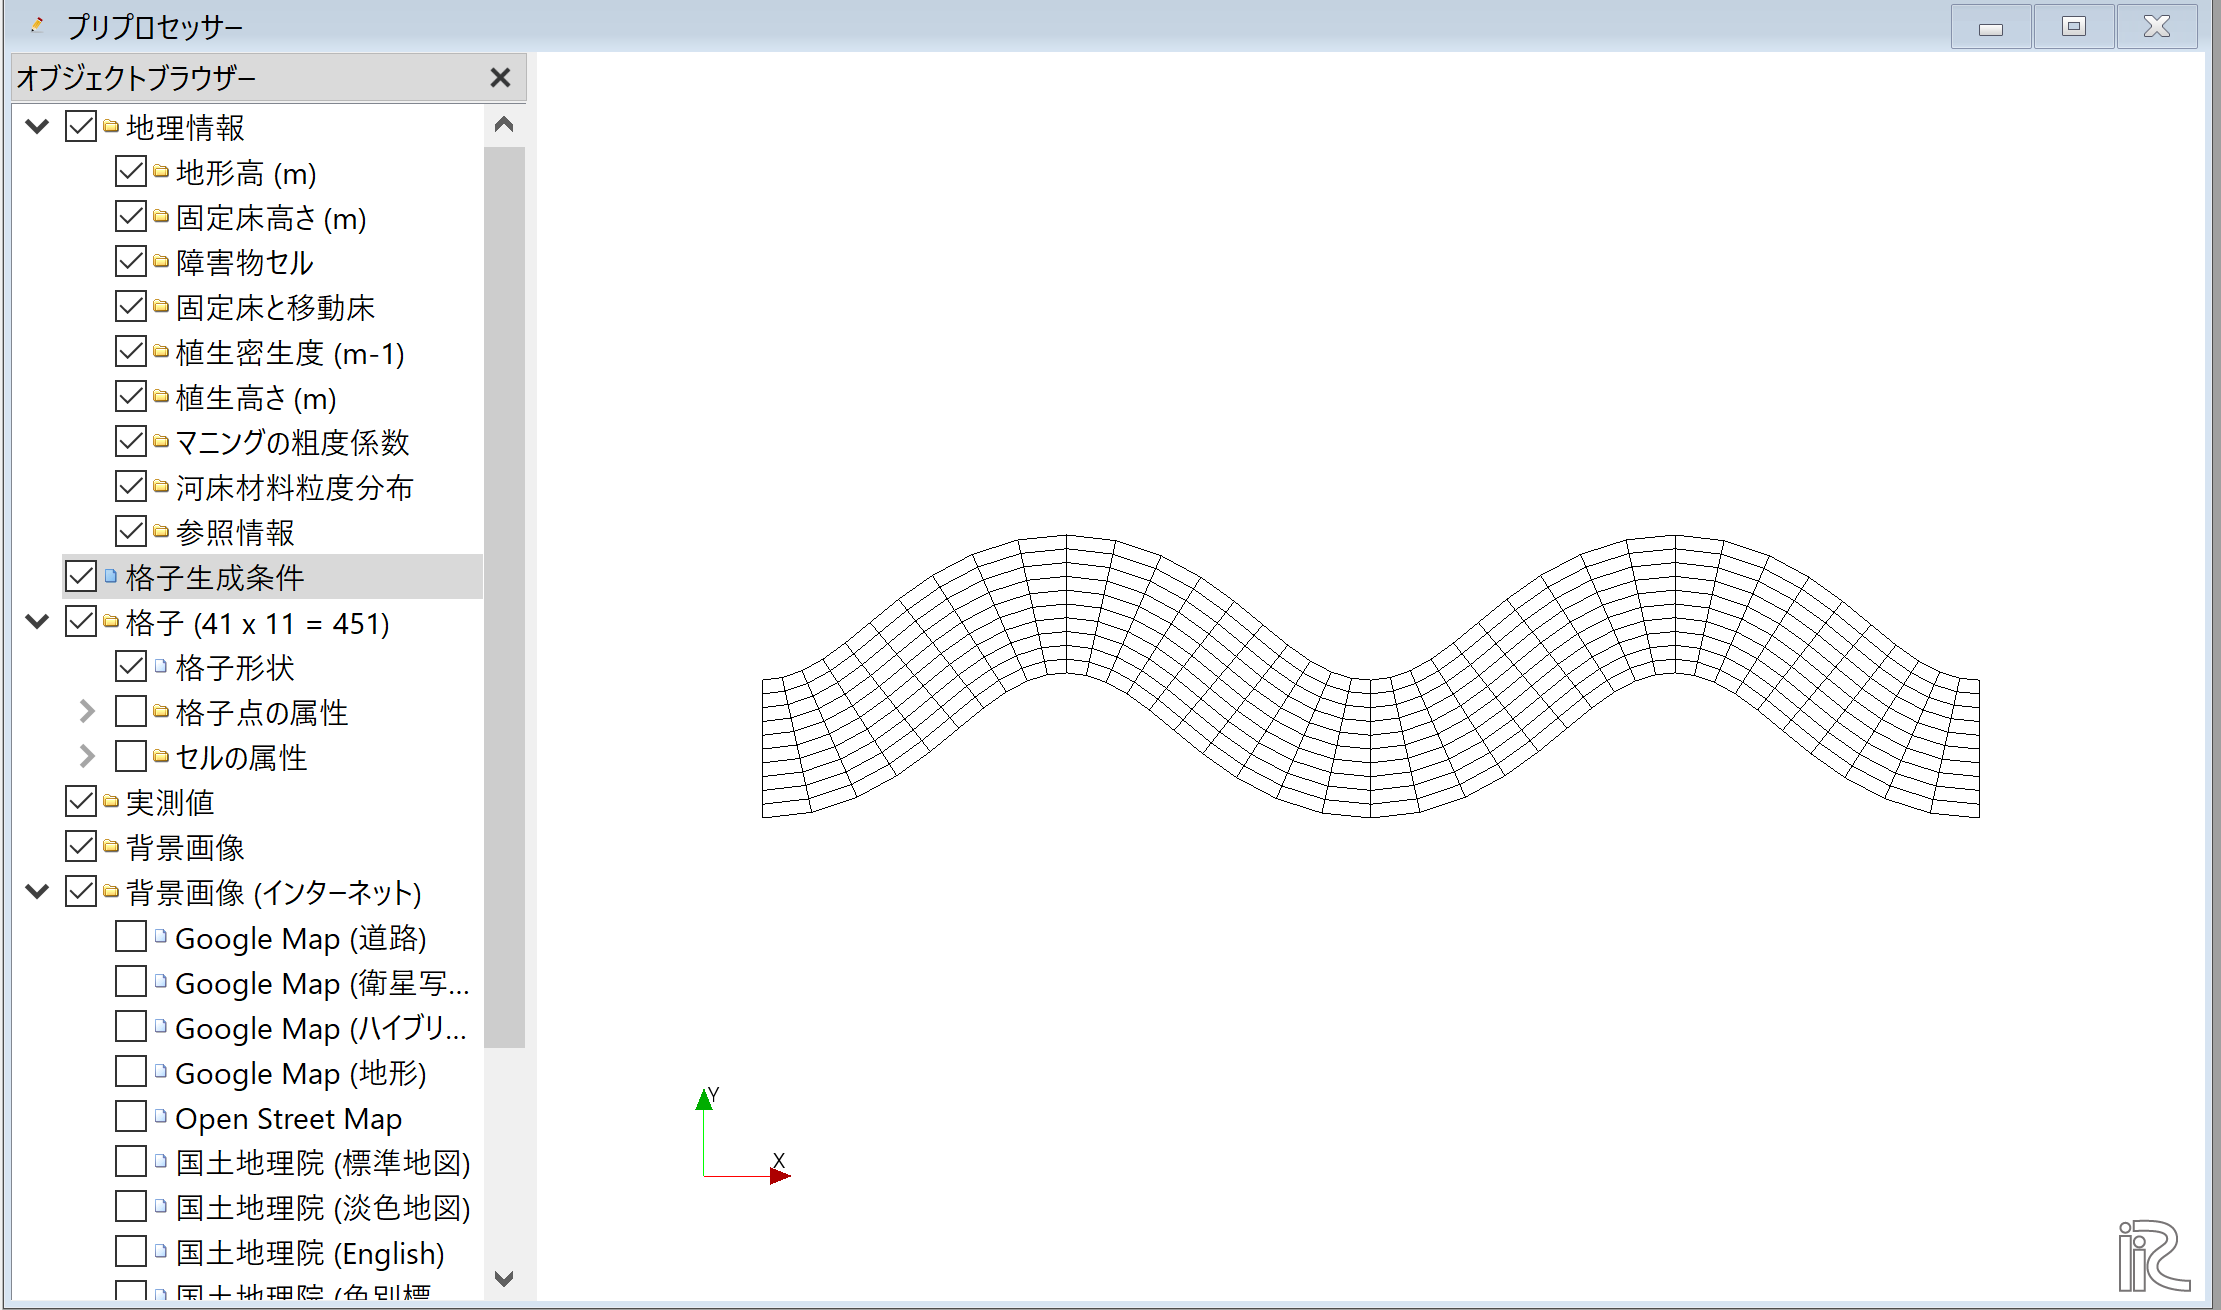
Figure 2.21 : プリプロセッサーWindow (計算格子)
オブジェクトブラウザーの[格子生成条件]で, [格子点の属性]と[地形高(m)]に✓マークを入れると 地形高がカラーコンターで表示され,指定した砂州形状を伴う蛇行水路の計算格子が生成されたことが分かります( Figure 2.22 ).
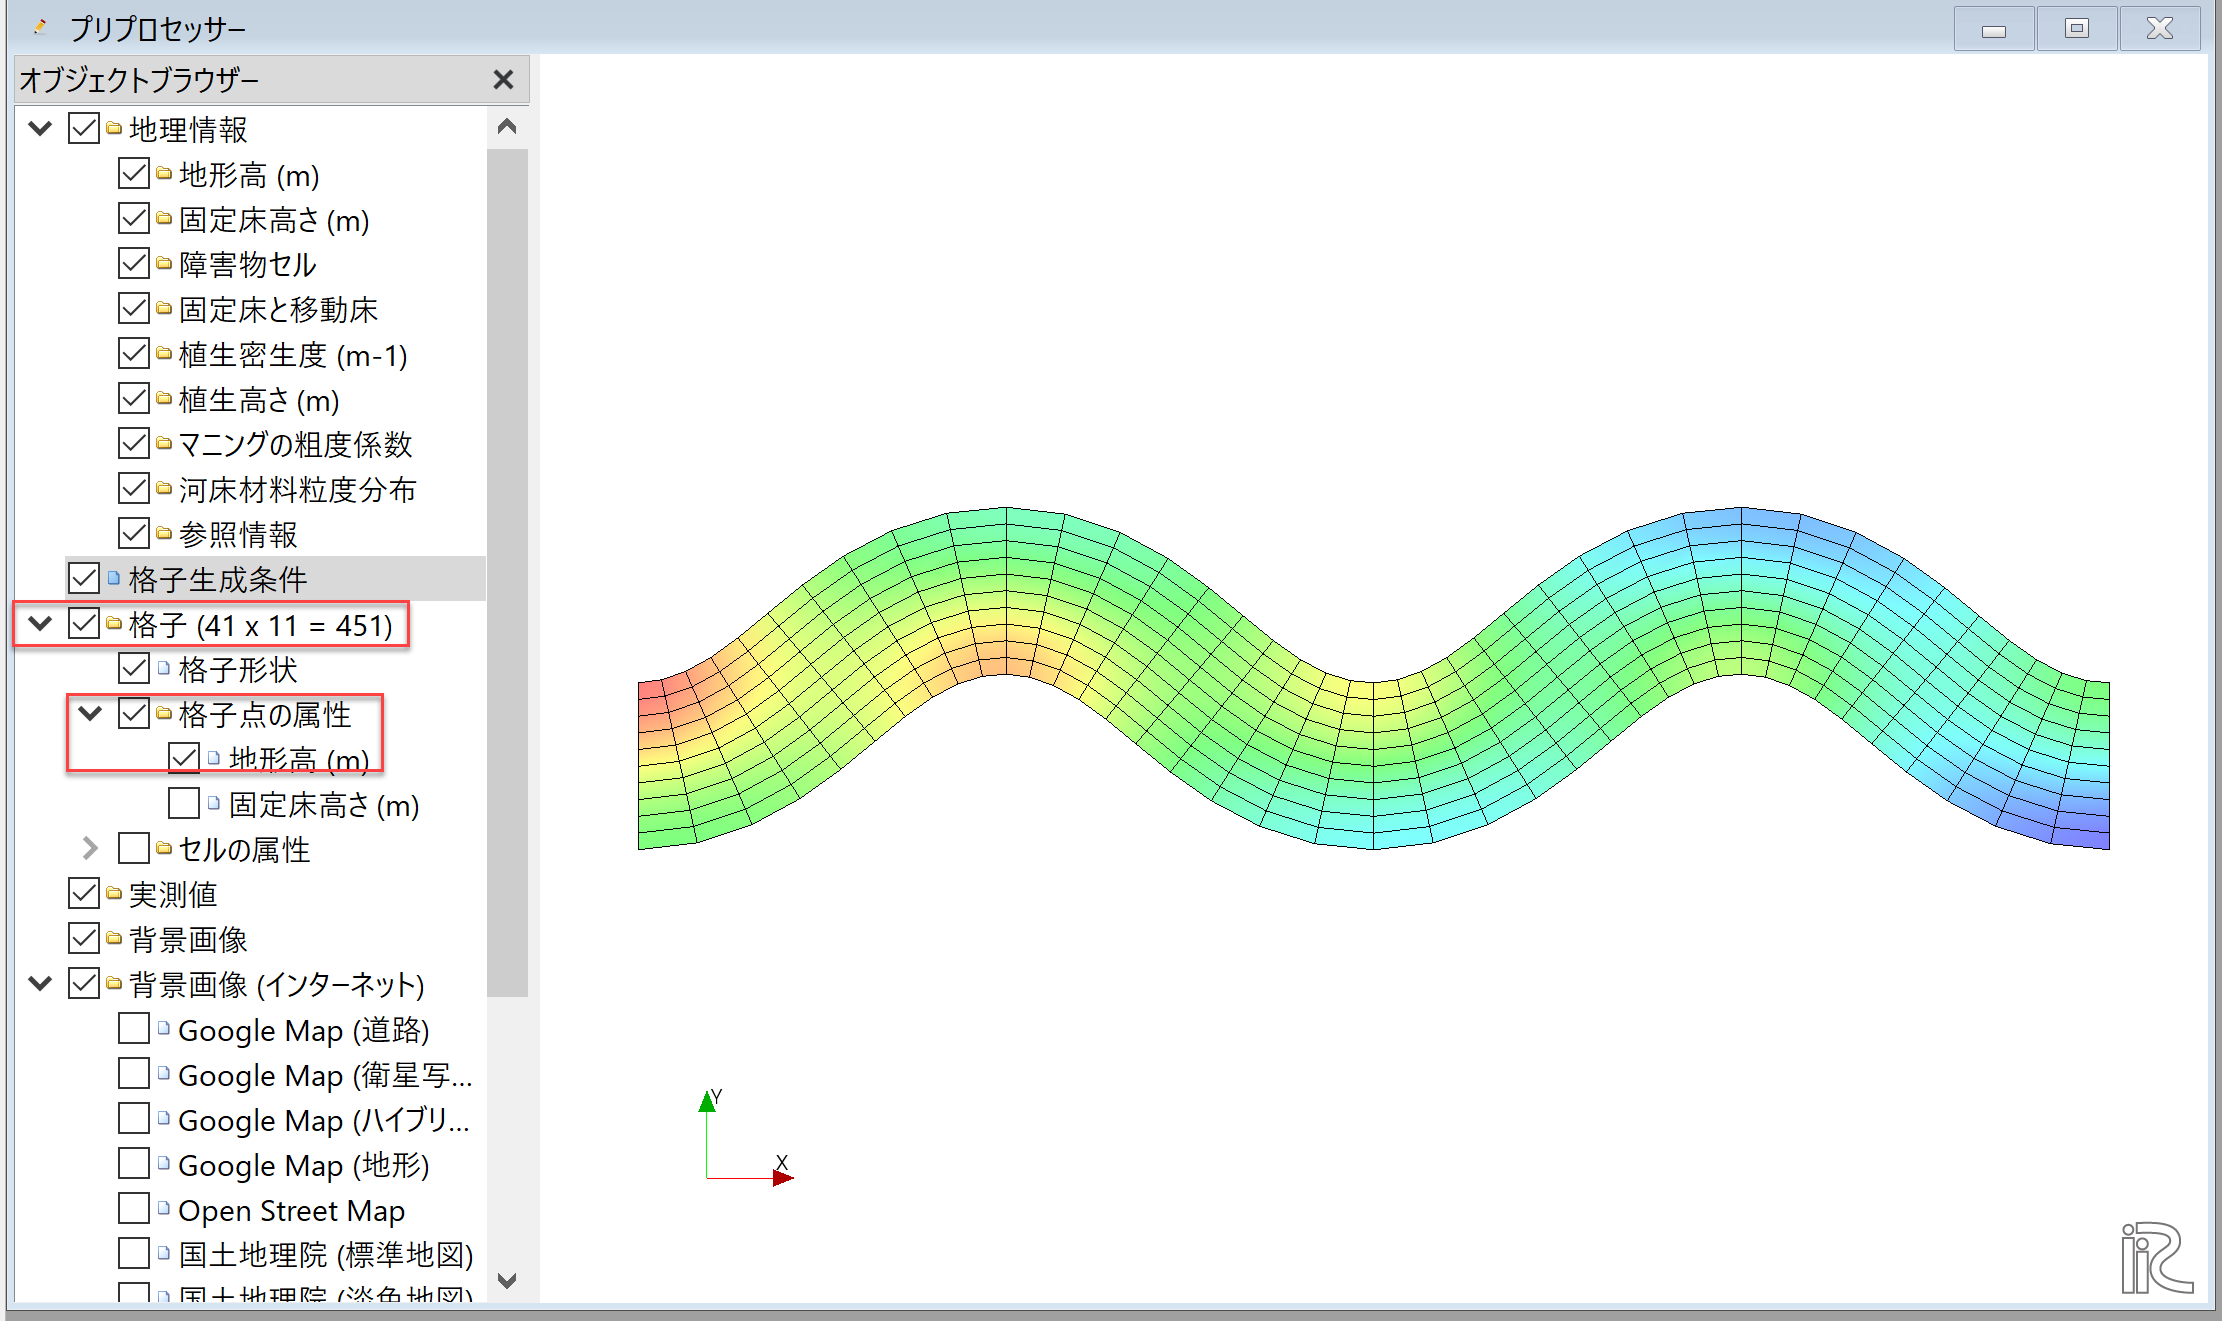
Figure 2.22 : プリプロセッサーWindow (河床高コンター)